


Manager: Laboratory,
The Southern African
Grain Laboratory NPC
During the 2018 harvesting season, a representative sample of each delivery of maize at the various grain intake points was taken according to the prescribed grading regulation. A total of 900 composite samples, representing white and yellow maize of each production region, were received and analysed to determine the quality. The samples consisted of 451 white and 449 yellow maize samples.
Production overview
The commercial maize crop for the 2017/2018 season totalled 12 510 million tons. This figure represents a year on year decrease of 25,6% compared to the all-time high record crop of the previous season, but is close to the previous ten-year crop average (12 065 million tons). White maize’s contribution to the total production was 6 540 million tons (52%) and that of yellow maize 5 970 million tons (48%).
2 318 850 ha constituted the total area utilised for maize production, almost 12% less than the previous season and 10% lower than the previous ten-year average. White maize was planted on 1 268 100 ha and yellow maize on 1 050 750 ha (compared to 1 643 100 ha and 985 500 ha respectively in the 2016/2017 season).
The 5,39 t/ha maize yield this season, although 1 t/ha lower than the all-time high of the previous season, was still the second highest yield recorded. The previous ten-year average is 4,67 t/ha. White maize yielded 5,16 t/ha and yellow maize 5,68 t/ha.
Grading quality
South African grading was done in accordance with the grading regulations for maize as published in the Government Gazette No. 32190, Government Notice No. R. 473 of 8 May 2009 and amended by Industry-Wide Dispensation Ref No: 20/4/14/1, dated 15 April 2010.
The maize crop was of good quality, with 78% of white and 89% of yellow maize graded as maize grade one, compared to the 85% and 92% of the 2016/2017 season. The percentage total defective kernels above and below the 6,35 mm sieve was 5,5% for white and 4,9% for yellow maize – respectively 0,8% and 0,5% higher than the previous season.
Slightly less Diplodia-infected kernels were observed on both white and yellow maize. Fusarium-infected kernels were also lower on white maize, but on yellow maize the average percentage increased with 0,4% to 1,2% compared to the previous season.
Foreign matter did not pose significant problems, with white and yellow maize each having four samples downgraded to class other maize due to foreign matter exceeding 0,75%. Only one yellow maize sample was downgraded as a result of other colour maize that exceeded 5%.
The average percentage combined deviations of white maize was 5,9%, compared to the 5,1% of the 2016/2017 season; that of yellow maize was also higher – 5,1% compared to 4,7% previously. The maximum permissible percentage combined deviations for grade one white maize is 8% and for yellow maize it is 9%. The term ‘combined deviation’ means the sum of defective kernels (above and below the 6,35 mm sieve), foreign matter and other colour kernels.
Of the 900 maize samples graded according to USA grading regulations, 51,3% were graded US1, 28,9% was US2, 9,9% was US3, 2,6% was US4 and 2,9% was US5. Sample grade and class mixed corn represented 3% and 1,4% respectively. The main reason for downgrading the samples was the percentage total damaged kernels exceeding the maximum limit per grade.
 Physical quality characteristics
Bushel weight/test weight is applied as a grading factor in the USA grading regulations, but is also routinely done at most intake points locally. Bushel weight in pounds (lbs) was determined on the maize crop samples and the results converted to test weight reported in kilogram/hectolitre (kg/hl), by multiplication with a factor of 1,2872.
Test weight, expressing the specific mass (or grain density) of maize, is influenced by amongst others, factors like cultivar, moisture content, foreign matter, other grain and damaged kernels (such as insect-damaged kernels and immature kernels).
White maize had an average test weight of 77 kg/hl compared to the 77,2 kg/hl of yellow maize. White maize’s average test weight was 0,7 kg/hl lower than the previous season and that of yellow maize 0,3 kg/hl higher. The test weight in total varied from 59,6 kg/hl to 82,5 kg/hl. The samples with the lowest test weight values originated from production regions mainly in the North West Province, the Free State and Mpumalanga.
The 100-kernel mass, which provides a measure of grain size and density, averaged higher for white maize than for yellow maize (34,3 g versus 31,5 g on ‘as is’ basis), as in previous seasons. As can be expected from these results, the kernel size of white maize, determined by sieving the samples through both 10 mm and 8 mm sieves, was larger than that of yellow maize and also larger than in the previous season.
Yellow maize kernels below the 10 mm sieve were also slightly larger than the previous season. The percentage yellow maize kernels above the 10 mm sieve was on average 15,1% lower than white kernels and the percentage kernels below the 8 mm sieve 11,2% higher than that of white maize.
Kernels that are too small hamper the separation of kernel fractions in the wet milling process as used by the starch manufacturing industry, resulting in a lower starch yield. A mixture of small and large kernels causes additional problems, as homogeneous steeping cannot be achieved. The dry milling industry also prefers fairly larger maize kernels. However, uniform kernel size is of particular importance to this industry, since too large kernels create problems, especially when mixed with smaller kernels. Kernel size is less important to the animal feed manufacturing industry. Larger kernels are nevertheless preferred, as small kernels are easily lost during the screening stage of processing.
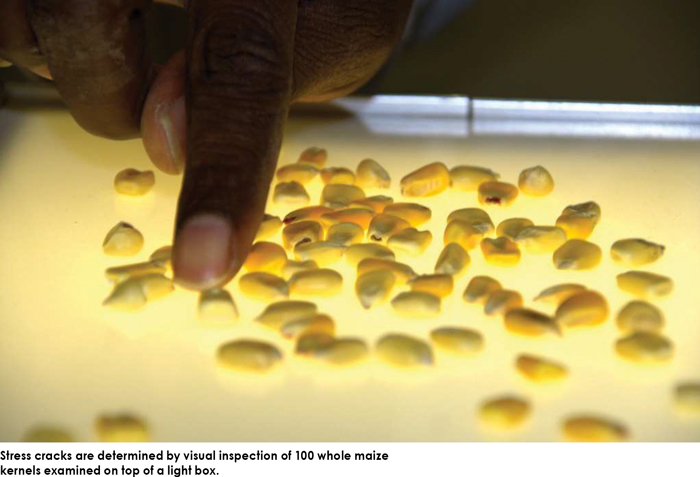
The percentage stress cracks observed varied overall from 1% to 38%, averaging 11% for white and 9% for yellow maize. These values are on average 3% higher than in the previous season. Stress cracks, an undesirable physical attribute in maize, are internal narrow fine cracks in the endosperm of the kernel, located just below the surface. Small numbers of stress cracks occur naturally in all maize (usually less than 3% due to the natural drying process on the field). High drying and cooling rates during post-harvest handling are, however, the major factors in stress crack development.
When moisture is removed from the kernel too quickly, the structure of the kernel fails and stress cracks form. Kernels with large numbers of stress cracks are more susceptible to breakage, yield smaller grits during dry milling, absorb water too rapidly during wet milling and are more susceptible to insect and mould damage during storage.
The milling index obtained from the SAGL Milling Index 2018 model on the Foss NIT Infratec 1241 – Generation 3 Standard Version Grain Analyser, varied from an average of 78,3 for white maize to 79,4 for yellow maize. The milling index, a dimensionless index value, indicates the relative ratio of total hard endosperm products (B2 grits, B3 fine grits and B3 coarse grits) to offal products (B1 fine flour and total chop/bran) as determined on the Roff laboratory mill. Samples analysed varied from soft (<40) to very hard (>100).
Grit Yield All values, obtained from the same model, averaged 64,4 for white maize and 64,6 for yellow maize. Grit Yield All is linearly correlated with the SAGL MI and indicates the true amount of total hard endosperm that can be extracted from the maize during Roff milling.
Roff milling and whiteness index
The average percentage total meal extraction in white maize obtained with the Roff mill was 79,1% (0,5% higher than the previous season) and varied from 70,9% to 83,8%.
White maize meal’s whiteness index as determined with the HunterLab ColorFlex 45°/0°, averaged 29,8 for unsifted and 19,2 for sifted maize meal. The sifted samples were obtained by sieving the unsifted samples through a 300 µm sieve.
Fractions on top and below the sieve were then combined to result in sifted samples that contain 87% of maize meal > 300 µm and 13% of maize meal < 300 µm. Sieving the sample eliminates differences in the readings as a result of particle size. The whiteness index of the previous season for both sifted and unsifted maize meal averaged lower, indicating meal that was not as white as this season.
Nutritional values
Moisture, fat, protein and starch contents are measured with an Infratec 1241 – Generation 3 Standard Version Whole Grain Analyser and reported on a dry (moisture-free) basis. The calibration is updated annually by Foss using NIT spectra and international primary chemical method results of maize crop quality samples from the specific season under discussion, provided by SAGL.
The fat content of white maize averaged 4,1%, slightly higher than the 4% of yellow maize. The average protein content of white maize was 8,7%, which was 0,3% lower than that of yellow maize. Both the fat and protein contents of white and yellow maize were similar to the previous season’s values. The average starch content of white maize (73,2%) was 0,9% lower than in the previous season and yellow maize (72%) averaged 1,7% lower. Yellow maize’s starch content was also lower than the ten-year average of 72,9%.
It was requested by the maize industry that crude fibre be added to the scope of analysis performed on the annual maize crop quality survey. As a result, crude fibre analyses were done on every tenth sample by means of the primary analysis method used by SAGL. The aim is to gather data to investigate the development of a calibration on the Infratec 1241 Grain Analyser (NIT) with the assistance of Foss.
Mycotoxins
Annual survey results of mycotoxin contamination in the main staple foods are world-wide critically important for developing sound practices to reduce the mycotoxin contamination along the value chain. The results of the mycotoxins monitored in local commercial maize over the past eight seasons provide insight to producers, traders and processors on the occurrence trends in white and yellow maize over all the production regions.
Approximately 35% of the maize crop samples are selected every season for multi-mycotoxin analyses to proportionally represent all the production regions as well as both white and yellow maize.
The 13 mycotoxins analysed with the LC-MS/MS instrument include the nationally regulated mycotoxins, aflatoxin B1 (and Aflatoxin total), fumonisin (FUM) B1 + B2 and deoxynivalenol (DON) as well as the mycotoxins listed for grains in the Codex General Standard.
In the 2017/2018 season, 75% of the tested samples contained one or more mycotoxin. This is a 13% increase compared to the 62% of the 2016/2017 season’s tested maize samples. The percentage samples with mycotoxins in the Free State and Limpopo increased two-fold when compared with the previous season.
In the different provinces, the percentage samples containing one or more mycotoxin showed notable differences. The trends in occurrence confirmed that mycotoxin risk varies significantly between production regions, seasons and maize class (white/yellow).
The survey confirmed the absence of aflatoxin B1 (classified as a cancer-causing hazard), B2, G1 and G2, T2-toxin, HT-2 toxin and ochratoxin A in commercial maize produced in all the regions over the past eight seasons. Zearalenone (ZON) was detected in only 9% of the white maize samples and 7% of the yellow maize samples. The highest ZON concentration, (361 µg/kg) was found in a white maize sample. The most predominant mycotoxins observed in all the seasons in most regions on both white and yellow maize are FUM B1, B2, B3 (in 44% of the samples) and DON (in 58% of the samples).
This season, the number of samples containing DON increased with 21% – from 37% in 2016/2017 to 58%. In contrast to the previous season, the highest increase in percentage samples with DON was observed in yellow maize – from 19% in the previous season to 51% of the samples this season. With the amendment of the SA Regulation in 2016 to include maximum allowable levels for human consumption, it is important to focus on the percentage samples with FUM and DON concentrations just below and above the maximum allowable levels; namely 4 000 µg/kg FUM B1+ B2 and 2 000 µg/kg DON in unprocessed maize.
The percentage samples with DON at different concentration levels in the past five seasons for both white and yellow maize, are summarised in Graph 1 and Graph 2. This season, only 34,9% of white maize samples contained no DON and a notable increase was observed in the percentage samples with DON concentrations larger than (>) 1 000 µg/kg over the last three consecutive seasons.
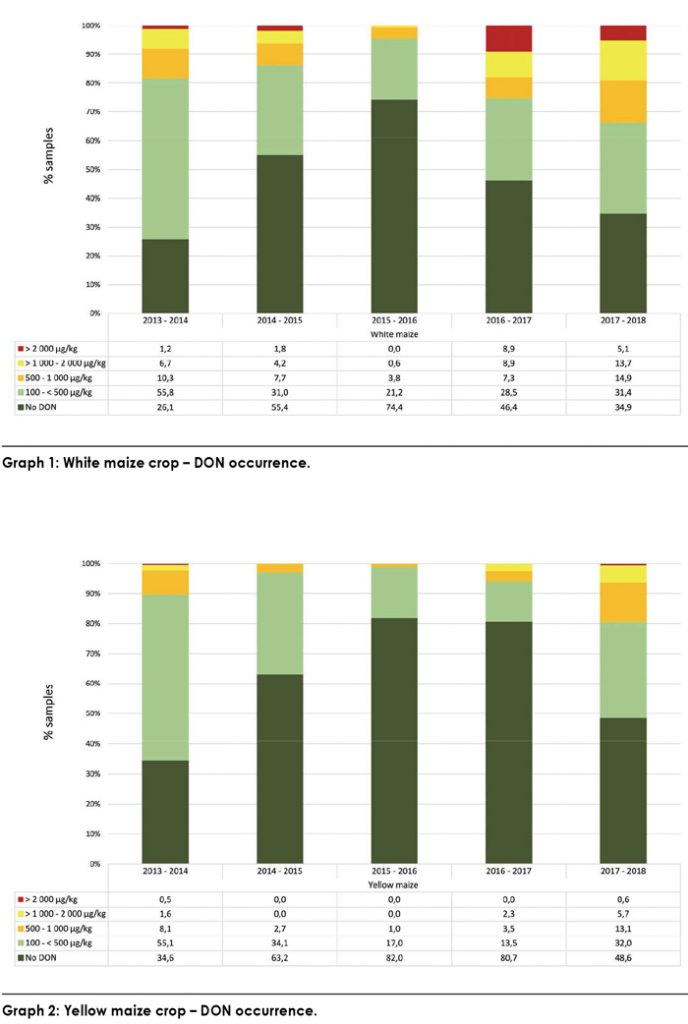 5% of the white maize samples (nine samples) were contaminated with DON concentrations above the regulated maximum allowable level of 2 000 µg/kg, as illustrated in Graph 1. The highest DON concentration of 3 510 µg/kg was also observed on a white maize sample. In contrast to the 81% yellow maize samples containing no DON in 2016/2017, only 49% yellow maize samples contained no DON in 2017/2018 and the percentage yellow maize with DON > 1 000 µg/kg increased from 2% in 2016/2017 to 6% in 2017/2018, see Graph 2.
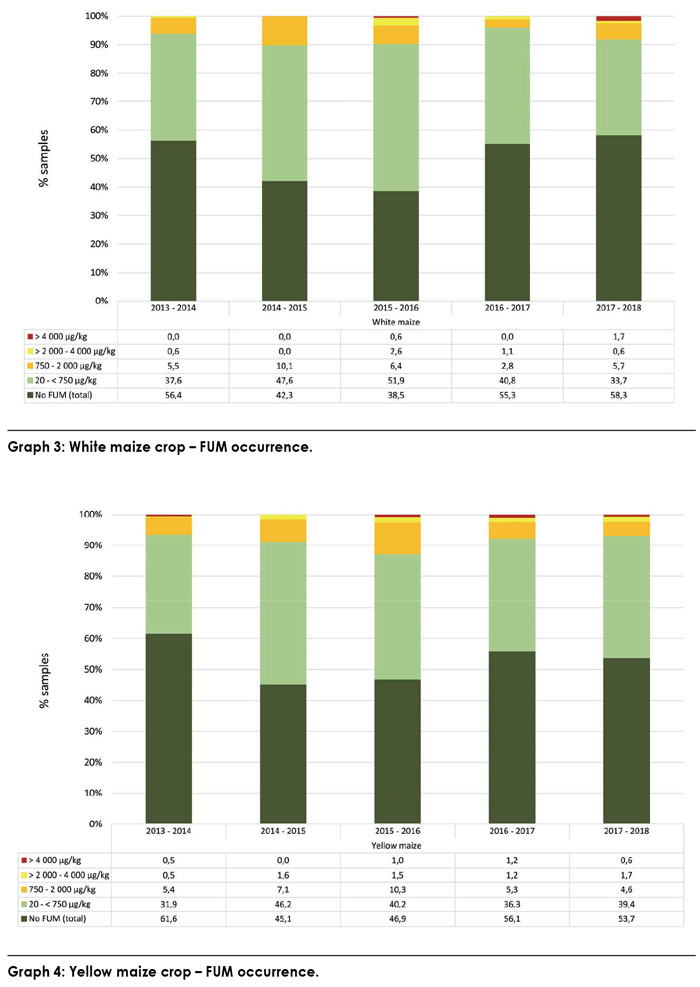
Fumonisins were found in 44% of the samples, similar to the eight-year average, with white and yellow maize also having almost the same incidence rates every season. However, in contrast to the 2016/2017 season, white maize samples containing FUM above 4 000 µg/kg were found this season, concentrations as high as 8 356, 7 328 and 4 505 µg/kg were reported in three different provinces. Graph 3 and Graph 4 summarises the percentage white and yellow maize with different FUM concentration levels over the past five seasons.
 The different patterns of the mean concentrations FUM, DON and ZON over the eight seasons in the different regions, confirmed again the well-known fact that the mycotoxin risk in maize produced differs from season to season in the same region and also from region to region. The reason being that the occurrence and concentration levels of mycotoxins are influenced by climatic factors during the pre-harvest production period.
In the 2017/2018 season, the white maize FUM mean concentrations increased notably in the Northern Cape, the Free State, Mpumalanga and Limpopo provinces. Yellow maize mean concentrations increased notably in Limpopo and KwaZulu-Natal.
ZON in white maize was found in the North West Province, the Free State, Mpumalanga, Gauteng and KwaZulu-Natal – as in the previous seasons. In contrast to the previous season when ZON in yellow maize was only found in the North West Province and
Mpumalanga, this season ZON was reported in all the provinces except Limpopo. It must be noted that ZON was not found in any maize samples from the Limpopo region over the past eight seasons.
Quality of maize imported during the 2018/2019 marketing season
A total of 171 578 tons of yellow maize was imported from Argentina and Brazil for local use during the period 28 April 2018 to 26 April 2019 (figures obtained from the South African Grain Information Service). No white maize was imported during this period. 15 samples, ten representing imported Argentinian maize and five representing imported Brazilian maize, were received at the SAGL for quality analysis purposes. One sample each from Argentina and Brazil was graded YM2, the rest were all graded YM1 according to South African grading regulations.
The results of the quality analyses performed on the imported maize were compared to those of the local maize crop of the corresponding grade and period (2017/2018). The average percentages total defective kernels on the imported maize were 1% to 1,3% higher than that of local maize. The 100-kernel mass and test weight of the imported maize were lower on average than local maize, while the percentage stress cracks were higher.
Kernel sizes of the imported maize were smaller – values above the 10 mm sieve were on average 6,6% to 8,9% lower. The average protein content of the imported maize was lower than that of the South African maize, while the average fat content was 0,2% to 0,4% higher. The starch content of the Argentinean maize compared well with local maize, while the Brazilian starch content was on average 3,3% lower.
Multi-mycotoxin analyses were done on two Argentinean and one Brazilian composite sample per shipment. The mycotoxin results did not raise any concerns. The FUM and DON residues observed were well below the national maximum FUM (B1 + B2) and DON levels for cereal grains and raw maize intended for further processing.
Please visit our website (www.sagl.co.za) for detailed results of this survey, as well as previous surveys. The reports are also available for download in a PDF format.
Sincere thanks to the Maize Trust for the financial support of these annual surveys and to the members of Agbiz Grain for providing the maize crop samples.


