


April 2018
DR CHRISTO JOUBERT, manager: Agro-Food Chains, Market and Economic Research division, National Agricultural Marketing Council and RIKA VERWEY, senior economist: Agro-Food Chains, National Agricultural Marketing Council
The maize meal value chain experienced many challenges throughout the 2016/2017 marketing year. South Africa found itself in a situation where the drought caused a shortage in the South African white maize market. This phenomenon resulted in drastic increases in maize and maize meal prices. The rand depreciated and therefore contributed to higher maize prices.
CEO’s of milling companies reported that the season was one of the most challenging in a long time. It was underpinned by very high maize prices, an unpredicted foreign exchange market and weak consumer demand.
The 2017/2018 season turned out to be South Africa’s biggest crop ever with maize prices decreasing to export parity levels.
This article provides information on the trends of maize and maize meal.
Price trends
The prices of the four main nodes in the food chain are the average producer price, the mill door price, the list price and the consumer price. In this case, the average producer prices and retail prices will be used to estimate the farm value, farm-to-retail-price-spread, retail value and farm value share.
The calculations of these items are based on the assumptions that:
- The producer price (also known as the farm gate price) is derived from the Safex spot price minus the average transport differential and handling costs.
- The transport costs from the farm gate to the silo are calculated as the average Safex transport differential to all the major maize silos.
- The handling costs are based on responses from silo owners about the estimated average handling costs and the daily storage tariff (per ton).
- Specific mill site costs are only available on an annual base. Therefore, the monthly mill site costs are kept constant throughout the year.
Graph 1 illustrates trends of white maize prices in South Africa. The average spot price for white maize started to increase in December 2015.
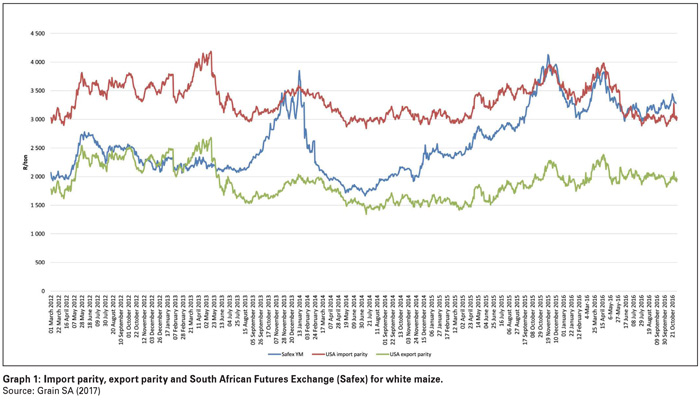
The spot price peaked at the beginning of January 2016 and rapidly increased even further to above import parity in March 2016. The average spot price for white maize was at R3 988/ton in December 2016.
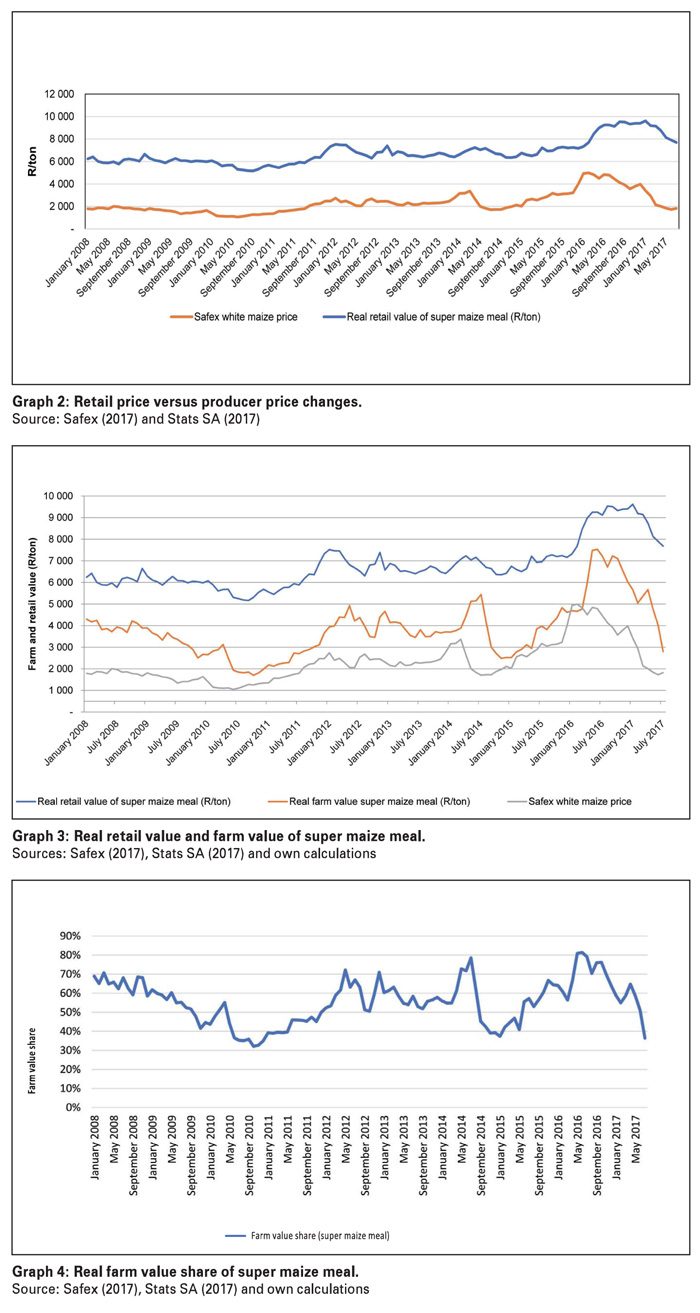 Graph 2 displays the retail value of maize meal as calculated by the National Agricultural Marketing Council (NAMC) and the spot price of white maize. Graph 2 shows the transmission time or lag between maize and maize meal prices.
The lag is between three and six months, with an average of four months. This assumption was supported by statistical tests, as well as the general opinion of the industry. The transmission of maize to maize meal is slower when the maize price decreases.
The delayed price transmission in retail stores may occur for a variety of reasons, including re-pricing (such as printing new shelf price labels) or temporary input price changes.
Farm value of super maize meal
The farm value is the value of the farm product’s equivalent in the final food product purchased by the consumers. The retail value is the price or the value of a given product at the retail level of a given commodity value chain.
Take note: Due to the data limitation for the monitoring of an average retail price for special maize meal (5 kg) by Stats SA for the period February 2015 to July 2017, this section will only include the spread for super maize meal (5 kg).
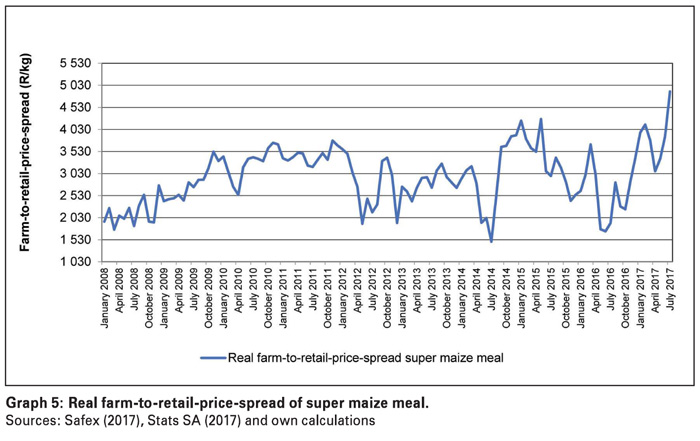
Graph 3 shows the trend in real farm and retail values of super maize meal, between January 2008 and July 2017. The real farm value of super maize meal increased from R4 300/ton in January 2008 and peaked at R7 532/ton in June 2016. The real retail value was R6 387/ton in February 2008 and increased to R9 537/ton in October 2016 and has since that period decreased significantly.
The farm value share is the portion producers received from the amount consumers pay for the product. Graph 4 displays the trend in the farm value share for super maize meal. The farm value share of super maize meal increased between early 2008 and 2016. Between 2008 and 2012, the average farm value share of super maize meal fluctuated between 32% and 72%, reaching 64% in December 2016. In 2017, the farm value share fluctuated between 30% and 64%.
The farm-to-retail-price-spread is the difference between what the consumer pays for the food product at retail level and the value of the farm product used in that product.
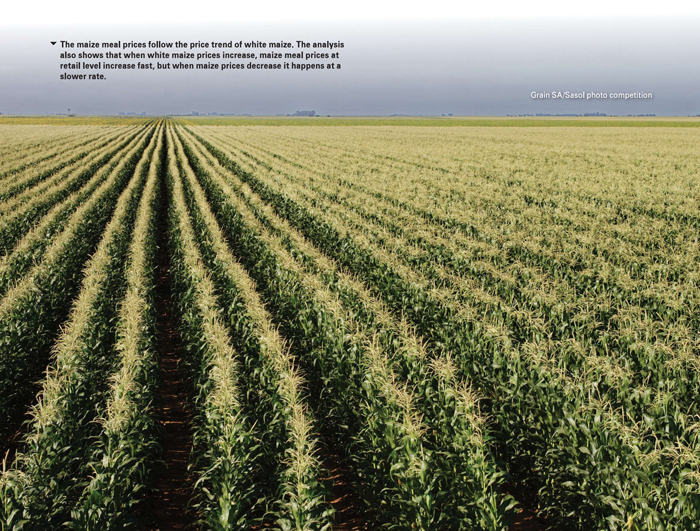
Graph 5 illustrates the farm-to-retail-price-spread for super maize meal between January 2008 and July 2017.
The farm-to-retail-price-spread showed high volatility as a result of the substitution effect between special and super maize meal.
When prices change, the likelihood arises that consumers tend to switch to more affordable options of maize meal or different products as disposable income comes under pressure. Between 2008 and 2017, the farm-to-retail-price-spread of super maizemeal fluctuated between R1 486/ton and R5 037/ton.
Summary
It is clear that maize meal prices follow the price trend of white maize. The analysis also shows that when white maize prices increase, maize meal prices at retail level increase fast, but when maize prices decrease it happens at a slower rate.
The assumption can be made that the prices at retail level have a slower transmission effect when maize prices decrease. The lag between the price of white maize and the price of maize meal between three and six months, with an average four months.
Publication: April 2018
Section: Relevant


