


manager: Laboratory, The Southern African Grain Laboratory NPC
Soybeans are the most important oilseed crop produced in South Africa, driven mainly by the demand for protein feed (in this case soybean oilcake) from the animal feed industry.
Of the 1,31 million tons of soybeans processed from March 2018 to February 2019, 1,9% was used for human consumption, 16,7% for animal feed as full fat soya and the bulk (1,06 million tons) was crushed to produce oil and oilcake. The quantity of soybeans crushed so far this season, is 19% more than the total quantity crushed during the previous season and double the ten-year average. Figures were obtained from the South African Grain Information Service (SAGIS).
A number of factors affect soybean protein and oil content. Unfortunately, some of these factors are outside of a producer’s control, such as the weather e.g. temperature, drought conditions as well as the timing of the drought conditions (early season or late season) and soil characteristics. Other factors include production practices and cultivar choice. Generally speaking, any factor affecting the protein content will inversely affect the oil content and vice versa.
Crude protein content
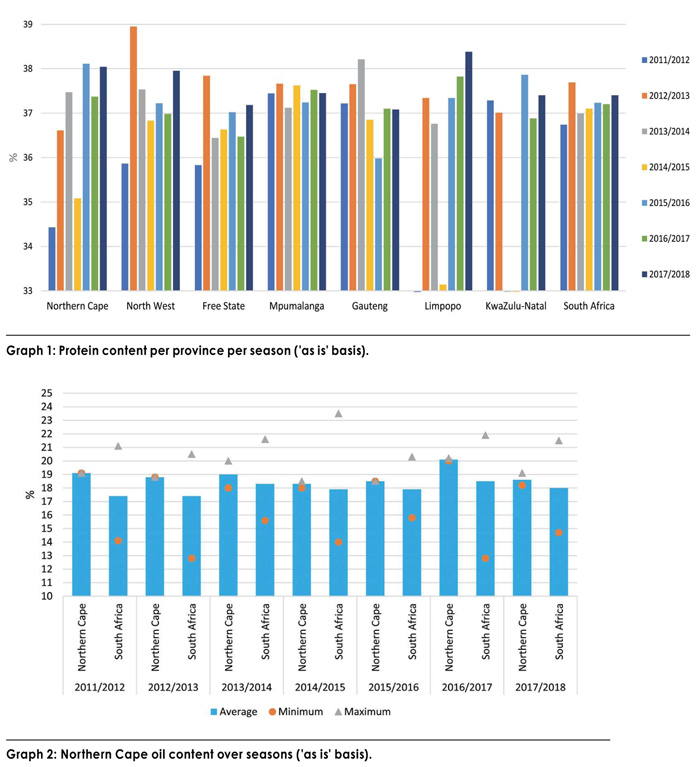
In the 2017/2018 production season, the weighted average crude protein content was 37,40% (‘as is’ basis), slightly higher than the 37,20% of the previous season. As in the 2016/2017 season, Limpopo had the highest weighted average crude protein content (38,38%). Gauteng (37,08%) and the Free State (37,18%) reported the lowest averages. See Graph 1 for a comparison of the average protein content per province per season (‘as is’ basis).
 Crude fat/oil percentage
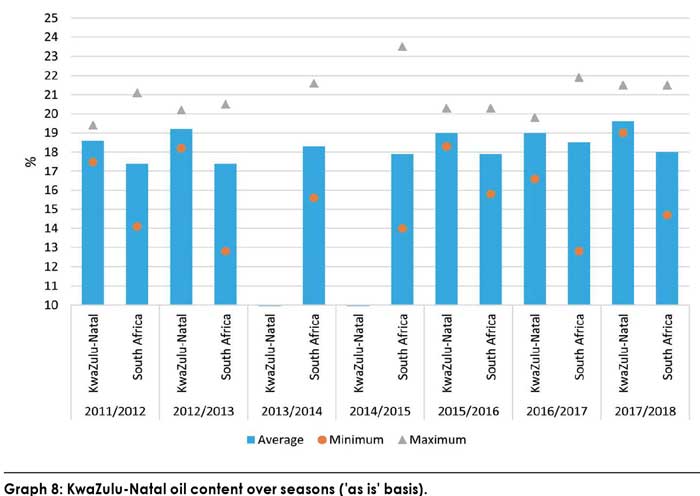
The weighted average crude fat/oil percentage of 18% (‘as is’ basis) was almost half a percentage point lower than the 18,4% in the previous season, but similar to the average values reported in 2014/2015 and 2015/2016. The samples from Limpopo had the highest weighted average crude oil content, namely 19,8%. The lowest average oil content was observed in the Free State with 17,6%.
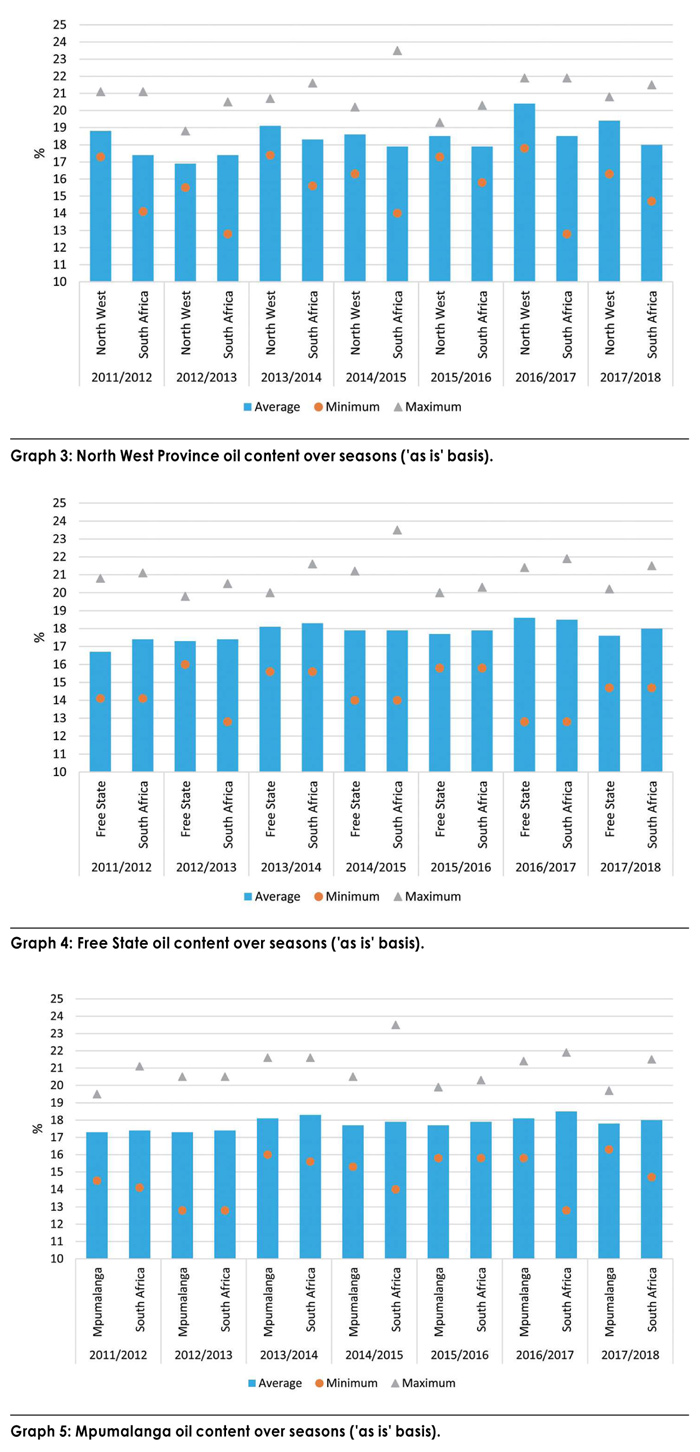
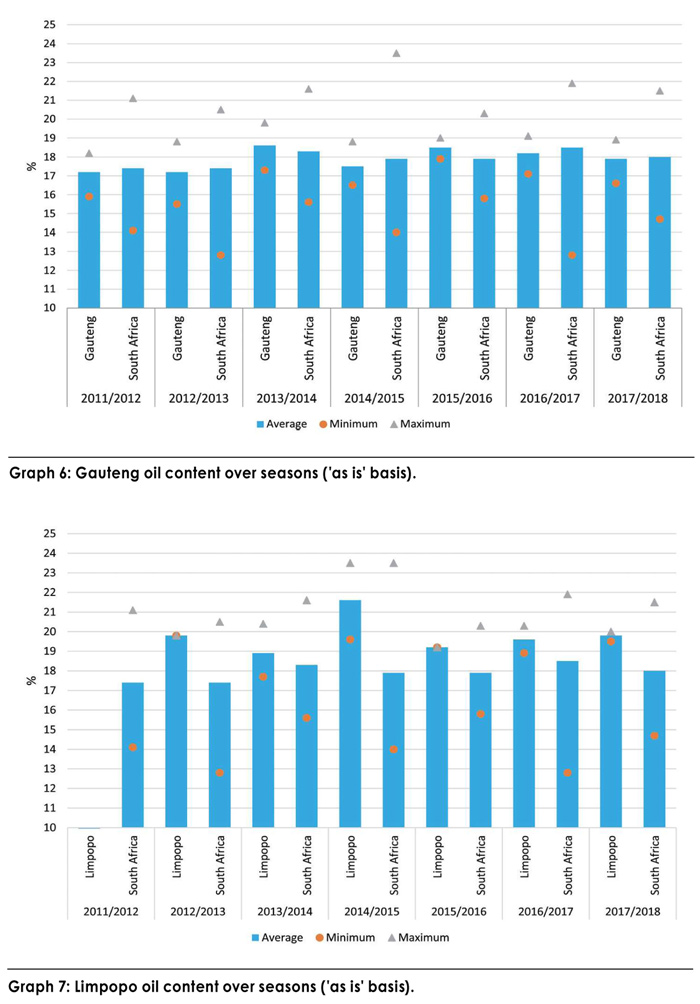
See Graph 2 to Graph 8 for a comparison of the average oil content per province compared to the national average over seasons. The minimum and maximum values are also indicated.
150 samples representing the various production regions were taken and forwarded to the Southern African Grain Laboratory (SAGL) by the commercial grain silo owners during the third quarter of 2018. Full grading was done in accordance with the Regulations relating to the Grading, Packing and Marking of Soybeans intended for sale in South Africa (Government Notice No. R.370 of 21 April 2017). 87% (130) of the samples were graded as Grade SB1, while 13% (20) of the samples were downgraded to Class Other Soya Beans (COSB). During the previous two seasons, 12% (2016/2017) and 11% (2015/2016) of the samples were downgraded to COSB.
The majority of samples downgraded this season was as a result of the percentage other grain present in the sample exceeding the maximum permissible deviation or as a result of the presence of poisonous seeds, namely Datura spp. or Convolvulus spp.
 Other deviations resulting in the downgrading of samples were the percentage foreign matter or soiled soybeans present or a combination of foreign matter, other grain, soiled soybeans, collective deviations as well as the presence of an undesirable odour. None of the samples graded contained wet pods.
Sclerotia
Samples containing sclerotia from the fungus Sclerotinia sclerotiorum decreased by 16% compared to the previous season (88 samples versus 105 samples). The three highest percentages sclerotia observed (0,36%, 0,32% and 0,30%) were on samples from the Free State. However, these percentages are still well below the maximum permissible level of 4%.
The national weighted average percentage this season was 0,06% compared to the 0,07% of the previous season.
Foreign matter
Gauteng (eleven samples) had the highest weighted average percentage foreign matter (1,43%). The percentage foreign matter in the rest of the samples ranged from 0,58% in Limpopo (four samples) to 1,38% in the Free State (45 samples).
Other grading factors and test weight
Gauteng also reported the highest weighted average percentage soybeans and parts of soybeans above the 1,8 mm slotted sieve which pass through the 4,75 mm round hole sieve, namely 2,02%. The samples from KwaZulu-Natal (nine samples) and the Northern Cape (two samples) were the lowest with 0,60% and 0,62% respectively. Mpumalanga (71 samples) averaged 1,57% and the Free State 1,74%. The national weighted average percentage increased from 0,88% the previous season to 1,54% this season.
The lowest weighted average percentage defective soybeans on the 4,75 mm sieve was observed on the samples from Gauteng, namely 0,98%. The Northern Cape reported the highest percentage namely 2,85%, followed by Limpopo with 2,74%. The national weighted average decreased from 2,22% last season to 1,91% this season.
This season the national weighted average percentage soiled soybeans were 1,53%, compared to the 2,87% of the previous season. Average weighted percentages per province ranged from 0,30% in the Northern Cape to 3,86% in North West Province (eight samples). Three samples exceeded the maximum permissible deviation of 10% according to the grading regulations. All three samples originated from Mpumalanga. Last season, eleven samples exceeded this grading limit.
Test weight values were determined by following the standard working procedure of the Kern 222 instrument as described in ISO 7971-3:2009, dividing the g/1 litre filling mass by two and extrapolating the values by means of the formulas obtained from the Test Weight Conversion Chart for Soybean of the Canadian Grain Commission. The weighted average this season was 70,9 kg/hl. Individual values ranged from 67,2 kg/hl to 74 kg/hl. The previous two seasons averaged the same as this season and ranged between 65,8 kg/hl to 73,6 kg/hl and 64,9 kg/hl and 73 kg/hl respectively.
Genetically modified soybeans
The EnviroLogix QuickComb kit for bulk soybeans was used to quantitatively determine the presence of genetically modified soybeans in 15 of the crop samples. The kit is designed to extract and detect the presence of certain proteins at the levels typically expressed in genetically modified bulk soybeans. The measurements made by using the above-mentioned kit is sensitive enough to detect one Roundup Ready soybean in 400 conventional soybeans (0,25%). All of the samples tested positive for the presence of the CP4 EPSPS (RR1/RR2) protein.
 Visit our website (www.sagl.co.za) for detailed results of this, the seventh annual survey, as well as previous surveys. The reports are also available for download in a PDF format.


