


December 2015
JOLANDA NORTJÉ, manager: Laboratory, Southern African Grain Laboratory NPC
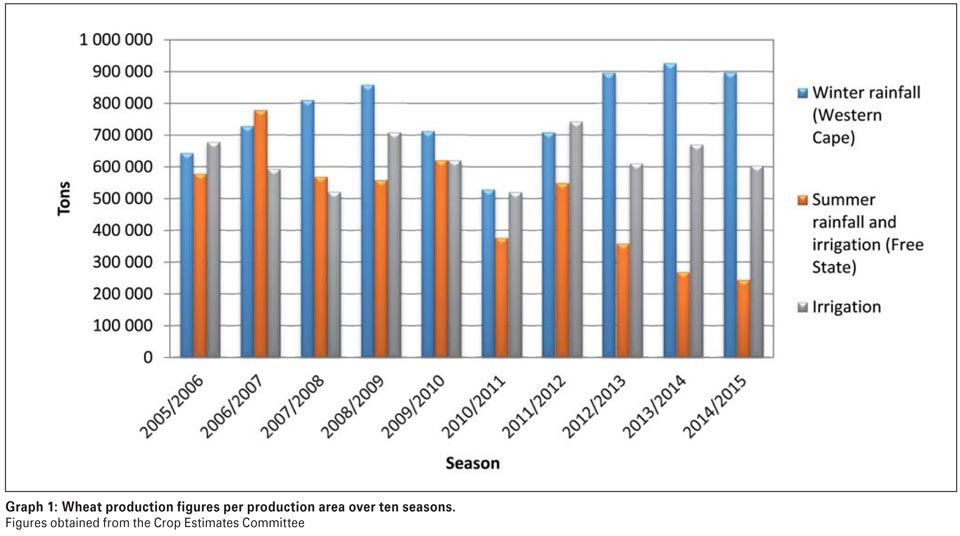
The commercial wheat crop of the 2014/2015 season was set at 1,750 million tons, which is 120 000 tons lower than the previous season’s crop and 7% lower than the ten year production average of 1 885 800 tons (2004/2005 to 2013/2014 seasons).
The Western Cape contributed just more than half of the total crop. The Northern Cape’s irrigation areas, although still the second largest producer of wheat, with 285 000 tons, produced 35 000 tons less than the previous season.
The area utilised for wheat production continued its declining trend, decreasing by almost 43% from the 2004/2005 season and by 6% compared to the 2013/2014 season. Decreased plantings by dryland wheat producers in the summer rainfall area (Free State) are the largest contributing factor to this observed decline. Dryland wheat is planted on approximately 73% of the total 476 570 ha, although its contribution is only 53% to the total crop figure.
The average national yield was 3,67 t/ha and varied with only 0,04 t/ha over the last three seasons. The yield in the main production areas ranged from 2,85 t/ha in the winter rainfall area (Western Cape) to 7,50 t/ha for irrigation wheat produced in the Northern Cape.
Wheat grades
The 337 representative crop samples were graded as follows: 31% was graded B1, 18% B2, 13% B3, 5% B4, 26% utility grade (UT) and 7% class other wheat (COW). The majority of the samples (69%) downgraded to utility grade was as a result of the percentage of either other grain and unthreshed ears or insect damaged kernels or a combination of both exceeding the maximum allowable level for grades B1 to B4.
The percentage total damaged kernels and/or combined deviations (19%) were also contributing factors. Of the samples downgraded to class other wheat, 68% was due to the presence of live insects and 24% as a result of the percentage field fungi infected kernels exceeding the maximum allowable level of 2%.
Grade B1 wheat in the Free State amounted to 48% (38% in the previous season). In the irrigation areas 46% (39% in the previous season) of the wheat graded as B1 and in the Western Cape 8% graded as B1 (12% in the previous season).
Cultivars
The most popular cultivars in the Western Cape were SST 015 (31,4%), SST 88 (28,7%), SST 056 (12,4%) and SST 027 (12,0%).
Producers in the Vaal and Orange River areas preferred SST 835 (26,7%) and PAN 3471 (23,9%), followed by SST 843 (16,4%) and SST 875 (13,7%). The most preferred cultivar in the North West Province was SST 843 (29,9%) followed by SST 835 (27,3%), Duzi (18,8%) and SST 884 (11,3%).
In regions 21 to 24 of the Free State, SST 387 (20,3%) was the prevalent cultivar, followed by PAN 3120 (14,1%), SST 835 (11,1%) and SST 843 (11%). Elands (17,3%) was the most planted cultivar in regions 25 to 28, SST 835, PAN 3161 and SST 356 were also popular cultivars with 16,3%, 15,5% and 10,7% respectively. In Mpumalanga, Gauteng, Limpopo and KwaZulu-Natal, SST 843 (29,3%) and SST 835 (26,8%) were the dominant cultivars, followed by SST 884 (15,8%).
The abovementioned percentages are weighted averages based on the top five cultivars per region as calculated from the cultivar identification done on each of the 337 crop samples.
Quality
All national, seasonal and regional averages provided in this article are weighted averages.
The national whole wheat protein average has varied with less than half a percent over the last three seasons, from 11,4% in the 2012/2013 season to 11,8% in the 2014/2015 season. The percentage of samples that has a minimum protein content of 12% (reported on a 12% moisture basis), increased from 39,5% in the previous season to 45,5%.
Although the winter rainfall areas again reported the lowest average whole wheat protein, namely 11,1%, this value is slightly higher than the previous two seasons. The production regions in the Free State reported the highest average protein content (12,4%) followed by the 12,1% of the irrigation areas.
The flour protein content of 10,7% was equal to the previous two seasons. The flour protein content is on average 0,5% to 1,2% lower than that of whole wheat. This protein loss can be attributed to the removal of the bran and aleuron layer as well as the germ during the milling process.
The Dumas combustion analysis technique is used for the determination of crude protein. Combustion of the sample at a high temperature (1 100°C) in pure oxygen sets nitrogen free, which is measured by thermal conductivity detection. The total nitrogen content of the sample is determined and converted to equivalent protein by multiplication with a factor of 5,7 to obtain the protein content. This factor is based on the amino acid composition of the proteins in wheat as well as the varying levels of non-protein nitrogen present in wheat.
Compared to the previous season, the average hectolitre mass increased by 0,7 kg/hl to 80,2 kg/hl and was just below the six year weighted average of 80,3 kg/hl. Of the 26 samples that reported values below the minimum level for grade B1 wheat, ten originated in the Western Cape (winter rainfall area), 15 in the Free State and only one in Mpumalanga. The regional averages ranged from 79,2 kg/hl in the Free State regions to 81,2 kg/hl in the irrigation areas.
The thousand kernel mass, reported on a 13% moisture basis, decreased from 39,3 g in the 2013/2014 season to 38,8 g this season. The winter rainfall areas had the highest average value, namely 39,7 g and the Free State the lowest at 36,8 g. Screenings (1,8 mm sieve) averaging 1,55% compared well with the previous two seasons.
To measure the enzyme activity (mainly the α-amylase activity), the falling number method is used as an indicator of kernel germination or sprouting. Both high (>400 sec) and low (<250 sec) falling numbers will have a negative effect on the baking quality.
The average falling number this season was 368 seconds. Samples from the Free State’s production regions gave the lowest average falling number of 352 seconds and those of the Western Cape gave the highest, namely 379 seconds. Compared to the 29 samples in the previous season, only four samples reported falling numbers below 250 seconds this season. All falling number values reported are corrected for the altitude at which the test was performed.
The average mixogram peak time on flour from the Quadromat mill averaged three minutes, comparing very well with the ten year average (2,9 minutes) as well as previous seasons. The mixogram peak time of the flour from the Bühler mill was 2,7 minutes, similar to the 2,8 minutes peak time last season.
Irrigation areas tend to have the longest peak time and the Western Cape the shortest. The peak time is a measure of optimum dough development and thus a measure of protein quality. Peak times of 2,8 to 3,5 minutes are generally considered acceptable.
The extraction rate is an indication of the flour yield that can be obtained from a given amount of wheat. Composite samples per class and grade per production region were cleaned, conditioned and then milled. The average Bühler MLU 202 laboratory mill extraction for the 70 composite samples was 73,4% – similar to previous seasons.
Colour is one of the important properties of milled grains and the colour of wheat flour affects the colour of the finished product. Generally speaking, a bright white colour flour is more desirable for most products. The Kent Jones colour (wet colour) method determines the influence of bran and/or extraneous material present in flour. The lower the Kent Jones colour, the lighter/brighter the flour and vice versa. The average Kent Jones colour this season was -3,3 KJ units, slightly lower than the previous two seasons.
A dry colour determination by means of a Konica Minolta CM-5 spectrophotometer is also performed. The colour coordinates in the CIE L*a*b* (CIELAB) colour model define where a specific colour lies in a Cartesian graph. L* represents lightness (100 being white and 0 being black), a* represents a green to red variation and b* represents a variation from blue to yellow. The results, with the range in brackets, were as follows: L* 93,77 (92,98 – 94,30), a* 0,44 (0,22 – 0,59) and b* 9,72 (8,21 – 11,11). These values correlate well with the previous two seasons.
Gluten is the water-insoluble complex protein fraction present in wheat flours and is composed principally of two functional protein components. Glutenin, the high molecular weight fraction, contributes elasticity (is less extensible); and Gliadin, the low molecular weight fraction, provides the viscous component (is highly extensible and less elastic).
The ability of wheat flour to produce dough with good gas retaining properties is therefore attributed to gluten. The wet gluten (14% mb) this season averaged 28,9% and the dry gluten also on a 14% moisture basis, 9,8%. These values are slightly lower than the previous season, but are still indicative of a good quality gluten for pan bread baking if the flour protein content of 10,7% is considered.
Wet gluten content can be correlated to loaf volume and dry gluten content to the crude protein content. The difference between the wet and dry gluten content is an indication of the water-holding capacity of the gluten proteins, which in turn is related to flour water absorption.
The average gluten index value was 87, ranging between 78 and 97. The gluten index provides an indication of the gluten strength and is not influenced by the protein content. A value between 70 and 100 is generally accepted good quality for bread baking purposes. The average gluten index value last season was 86.
As it is formed from flour and water, developed and broken down, a dough’s resistance to mixing is measured and recorded by the Farinograph. This resistance is called consistency. The water absorption is the amount of water required for a dough to reach a definite consistency (500 Brabender units) and is expressed as a percentage of the flour mass, reported on a 14% moisture basis.
This season’s average water absorption was 59,5% compared to the 60,1% of the previous season. The Free State area had the highest water absorption of the three production areas, albeit only slightly.
The development time is the time from the beginning of water addition until the dough reaches its optimum consistency. A long development time can be associated with flours with a high percentage of gluten-forming proteins.
The average development time was 5,3 minutes (5,2 minutes during the previous season). The irrigation areas had the longest development time of 6 minutes.
The stability is the time during which the top of the curve intercepts a horizontal line through the centre of the curve. This gives an indication of the dough’s tolerance to mixing: The longer the stability, the longer the mixing time that the dough can withstand. A dough with a longer stability can also withstand a longer fermentation period. The stability value of 8,3 minutes compared well with the 8 minutes reported previously.
The mixing tolerance index value provides an indication of the extent to which breakdown of the dough occurs after reaching its optimum consistency. The higher the value, the more and the quicker the breakdown of the dough occurs. There was no significant difference between the mixing tolerance indexes of the 2014/2015 (35 BU) and the 2013/2014 (38 BU) seasons.
The Alveograph measures the resistance of the dough to stretching and also how extensible the dough is. A sheet of dough of a given thickness is prepared under specified conditions and expanded by air pressure into a bubble until it ruptures. The pressure inside the bubble is measured. The area under the curve gives an indication of the dough strength. The average strength was 38,1 cm² (37,6 cm² the previous season). The irrigation areas had the highest average strength of 42,1 cm² and the Western Cape the lowest with 33,1 cm².
The stability (P) is an indication of the resistance of the dough to extension (force required to blow the bubble of dough) and averaged 75 mm. The distensibility (L) corresponds with the maximum volume of air that the bubble can withhold and provides an indication of the extensibility of the dough. This value averaged 133 mm and was longer than in previous seasons.
By dividing the P-value by the L-value, the P/L ratio is obtained, thus providing an approximate indication of the shape of the curve that combines stability and extensibility (viscoelastic properties). The average value this season was 0,59.
The Extensograph measures the resistance and extensibility of a fully mixed, relaxed flour-water dough, by measuring the force required to stretch the dough with a hook until it breaks. For bread baking purposes, a strong dough with good extensibility, good resistance, a large area and a well-balanced height to length ratio is needed.
The strength gives an indication of the total force (work) needed to stretch the dough and is represented by the area under the curve. The average strength was 97 cm² (92 cm² previous season). The maximum height/resistance gives an indication of the dough’s resistance to stretching.
Compared to the previous season (358 BU in 2014/2015 and 341 BU in 2013/2014), the maximum height did not increase significantly. The extensibility indicates the stretchability of the dough. The extensibility value of the current season were equal (196 mm) to the previous season (194 mm).
The 100 g loaves baked using the straight-dough optimised bread making method, received an average evaluation rated as “excellent”. The basis for this evaluation refers to the relationship between the protein content and the bread volume.
Mycotoxins
Mycotoxins, secondary metabolites produces by field and/or storage fungi on agricultural commodities, is foremost a food safety issue, but the occurrence of these fungi can also lead to a reduction in the quality of the commodity. Most mycotoxins are chemically stable and tend to survive storage and processing even when cooked at quite high temperatures as is reached during bread baking. Environmental factors, such as temperature, humidity, soil and storage conditions influence toxin production.
40 randomly selected samples, representing different regions as well as classes and grades, were tested by means of a SANAS ISO/ IEC 17025 accredited multi-mycotoxin screening method using UPLC-MS/MS. The samples were tested for Aflatoxin G1; B1; G2; B2, Fumonisin B1; B2; B3, Deoxynivalenol, 15-ADON, HT2 – Toxin, T-2 Toxin, Zearalenone and Ochtratoxin A.
Five samples tested positive for deoxynivalenol (DON) residues. The average value of the five positive results was 229 µg/kg (ppb) and the highest value measured 361 µg/kg, which is still well below international maximum residue levels.
Wheat imported during the current marketing season
According to SAGIS figures (27 September 2014 to 11 September 2015) 1 691 761 tons of wheat have been imported into South Africa thus far this season, compared to the 1 668 412 tons the previous season.
Wheat has been imported from Argentina, Australia, Canada, Germany, Latvia, Lithuania, Poland, the Russian Federation, the Ukraine and the United States. Imports from Germany and the Russian Federation comprised more than half (21% and 33% respectively) of the total figure.
The import quality results are published at the end of each production and marketing season and are available on the SAGL website (www.sagl.co.za).
With gratitude to the Winter Cereal Trust for financial support of this annual survey and to Agbiz Grain members and milling companies for providing the crop samples.
Publication: December 2015
Section: Relevant


