
October 2018
DR GERHARD BACKEBERG, executive manager: Water Utilisation in Agriculture, Water Research Commission
 The estimations of the area of irrigated crops in South Africa are currently outdated and vary greatly. Various assessments since 1990 documented the area under irrigation, using different approaches. According to these estimates, the area under irrigation ranged between 1,21 million ha to 1,58 million ha and the area registered for irrigation was between 1,44 million ha and 1,68 million ha.
In order to address the knowledge gap regarding the appropriate methodology and obtaining recent empirical evidence of the irrigated area, a research project was initiated by the Water Research Commission (WRC) in 2013, which was co-funded by the Department of Agriculture, Forestry and Fisheries (DAFF).
The overarching aim of this research project, led by Prof Adriaan van Niekerk from Stellenbosch University (SU), was therefore to update the existing estimations of the area and volume of water used by irrigated agriculture in South Africa. As stated in the published WRC report, the project by SU was undertaken with national and international partners.
Remotely sensed earth observation (EO) data are regularly captured from a wide variety of aerial and satellite platforms. The wide coverage and cost-effective nature of earth observation images are not only ideal for determining the area under irrigated agriculture, but have for many years been employed in energy balance modelling to provide up-to-date estimates of actual evapotranspiration (ET) and the total volume of water utilised by irrigated agriculture.
A literature review of existing methods confirmed that earth observation is the only viable approach to use for national assessments. This research consequently applied various earth observation and geographical information systems (GIS) techniques, including the mapping of irrigated agriculture and the modelling of actual evapotranspiration.
Monthly datasets of evapotranspiration for a twelve-month period were generated for the entire South Africa. The evapotranspiration datasets describe the water consumption and crop production on land between 1 August 2014 and 31 July 2015 and thus capture the phenology of vegetation, crop production cycles and associated water consumption in South Africa. The generation of the irrigated area map and the calculation of the total water use by irrigated crops were informed by these datasets.
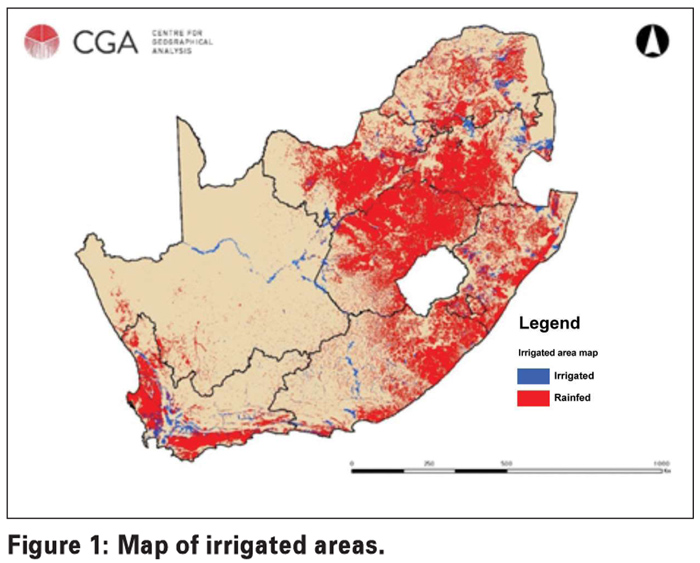
The ETLook model used to produce the monthly evapotranspiration dataset proved robust despite some challenges with available and accurate (spatial) rainfall data. The irrigated area map generated using the evapotranspiration dataset – along with other remotely sensed data – was judged highly accurate by participating stakeholders. All known misclassifications were manually corrected to produce the final, validated third version of the map.
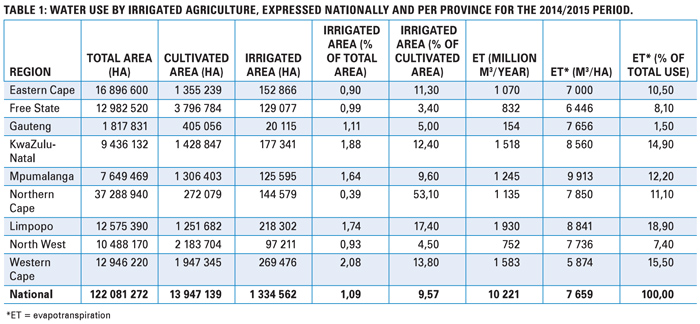
According to the map 1 334 562 ha of South Africa’s land surface was actively irrigated during 2014/2015. This constituted about 10% of the total area under cultivation (including fallow areas) of the area used for agriculture in 2014/2015. Western Cape had the highest area (260 476 ha) under irrigation, with Limpopo having the second largest area under irrigation (218 302 ha).
The national aggregation of evapotranspiration for all irrigated areas in 2014/2015 showed that the total consumptive water use from irrigated agriculture in South Africa was 10 221 million m3 per year. This compares well with previous estimates such as the 1997 Overview of water resource availability and utilisation in South Africa, which estimated the water use by irrigated agriculture to be 10 740 million m3 per year.
It is known that South Africa has a limited availability of suitable land and adequate water resources for irrigated crop production. With the added pressures of climate change, population growth and decline in water quality, the need for improved assessments of the current water resources and land use is critical.
Actions related to improved water use efficiency (WUE) and irrigation expansion can only follow once this information is available. This project and report have contributed recent and accurate information on water use by different irrigated crops over time (i.e. throughout the growing season) and space (i.e. in different geographical areas). Combining these datasets into a water accounting (WA) framework will improve understanding of the actual pressures on South Africa’s water resources with changes in land use, that will better inform water use for irrigated agriculture.
In summary it can be stated that the knowledge gap has been closed by applying Earth Observation methodology that is at the forefront of international research practice. Breakthroughs through research have therefore been made by providing practically relevant knowledge which is of high priority. In this regard the report gives an excellent overview of the status quo of irrigated agriculture water use for the period of 1 August 2014 to 31 July 2015.
It must again be emphasised that the study established a methodology that can be replicated for other periods. Thereby it gives competitive advantage to DAFF for further implementation of available research results which have been created by SU through funding by the WRC and DAFF.
Taking these innovative research results and demonstration of application forward to practical implementation, a number of issues have to be considered: First, it is unlikely that the irrigated area mapping (IAM) and water use quantifications produced in this project are representative of the long-term situation. The application of the methodology to other periods is essential in supporting sound water management practices and guiding decisions about changes in water use allocations.
Second, the FAO recently released an Africa-wide, freely available, monthly open access of remotely sensed derived evapotranspiration dataset at 250 m resolution (also generated using the ETLook model and thus very similar to the evapotranspiration dataset used in this project) for the period 2009 to 2019. This will considerably reduce the cost of future implementation in South Africa. Linked with the recently released and freely available Sentinel 2 imagery, the evapotranspiration datasets available through the FAO will allow for the production of seasonal (even monthly) IAMs and water use quantifications up to 2019.
Third, if the irrigated area mapping process is automated, the latency (period required for production) can be reduced to a few weeks, which will substantially increase the reliability of the water use estimations, as it will allow for local validation to be carried out.
Finally, based on the findings of this research, it is mainly recommended that:
- The irrigated area mapping procedure is automated and funding for implementation of the procedure by DAFF is prioritised.
- The irrigated area map is continuously (i.e. on a monthly or quarterly basis) updated.
- Consumptive water use of irrigated crops is revised on a continuous (seasonal) basis at national scale.
- The water accounting framework is applied on primary catchment level, preferably in all catchments of South Africa.
For more information contact the author at gerhardb@wrc.org.za.
Publication: October 2018
Section: Focus on irrigation


