

January 2019
LORREN DE KOCK, associate practitioner: Blue North and DR HENDRIK SMITH, conservation agriculture facilitator, Grain SA
Grain SA initiated the Carbon Footprint Project, with Phase 1 of the project aiming to calculate and compare the greenhouse gas emissions of different farming systems in the winter grain region in the Western Cape. An increase of greenhouse gases in the atmosphere traps the sun’s radiation or energy, directly leading to an increase in the earth’s temperature or so-called global warming (IPCC, 2007).
 The most common greenhouse gases in the atmosphere are water vapour, carbon dioxide (CO2), methane (CH4), nitrous oxide (N2O) and ozone. Human activities have led to a significant increase in the concentration of specifically CO2 in the atmosphere from the burning of fossil fuels (coal, oil and natural gas), deforestation, land use change and soil erosion (Earth System Research Laboratory, n.d.).
Greenhouse gas emissions are measured in carbon dioxide equivalents (CO2e) which takes into account all the other greenhouse gasses, and will be further referred to as carbon emissions.
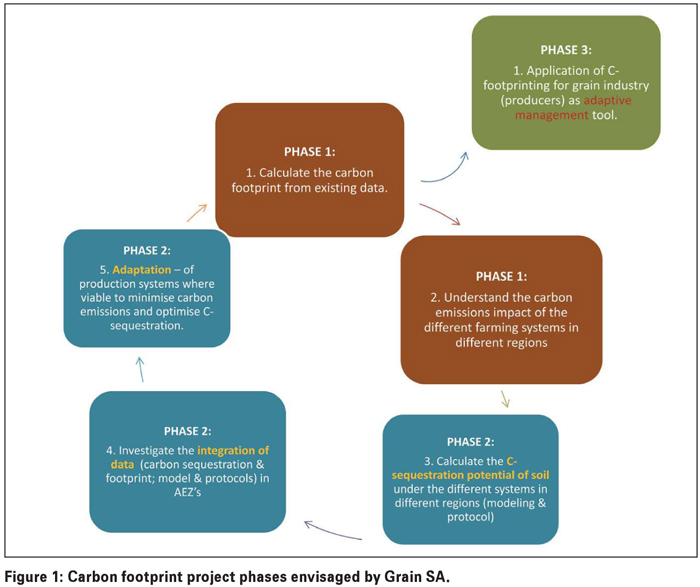
Phase 1 was the start of a longer term process of using the carbon footprint methodology and results within the grain industry as an adaptive management tool (Figure 1).
Project scope and methodology
The study only included activities and inputs at the farm stage of the grain value chain. The methodology used to calculate the carbon emissions per ton grain was the PAS 2050: 2011 protocol developed by the British Standards Institute (BSI). Carbon emissions is only one of a range of impacts that needs to be taken into account to obtain a holistic view of the environmental impacts of a farming system.
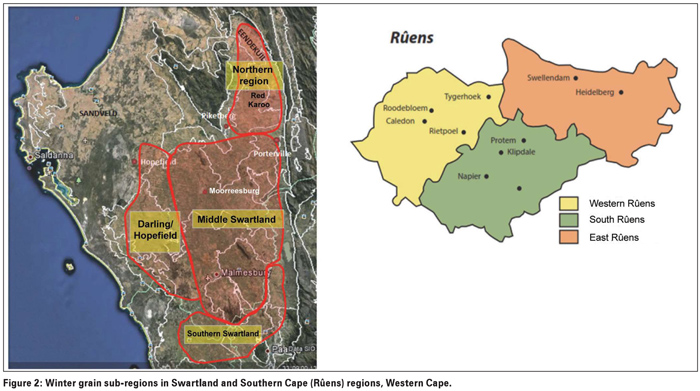
Winter grain sub-regions included in this study are presented in Figure 2. Existing data (inputs and yields) was collected from representative production practices in each region to model the current scenario of carbon emissions.
The current scenario consists of a combination of conventional and conservation agriculture farming systems (current CA) currently practiced in these regions. For the future scenario, an ideal but realistic CA system (future CA) predicted to be adopted by most grain producers 20 years into the future was calculated with corresponding inputs and yields.
In the Western Cape there is currently no big difference between conventional farming and CA. The conventional wheat farming system does not practise crop rotation and therefore wheat is planted every year. In the current CA and future CA systems crop rotation is practised and the commodities included in the models per region were wheat, barley, canola, medics and lupins. All inputs were specified on a per hectare basis. The carbon emissions (kg CO2e/ton) per farming system were calculated from the data provided.
In order to calculate a regionalised carbon emission profile, the results per commodity were weighted according to the yield per farming system.
Thereafter these figures were extrapolated to provide a snapshot winter grain region carbon emission profile for the current and future scenarios.
In addition to the regionalised carbon emissions for the current and future farming scenarios, farming input hotspots were identified. Hotspots are defined as activities which contribute the most to the overall carbon emissions and are therefore categorised as ‘carbon intensive’.
The snapshot carbon emissions per ton product for the winter grain region currently and for the future were determined through a pro-rata allocation of the result to the total yield per commodity. According to best available estimates, approximately 90% of total grain yield (tonnes) in the Western Cape are currently under CA, while the remaining yield is under conventional. With the calculation of the future scenario it is predicted that 80% of the total yield will be under future CA.
Data and inventory
Information from the Crop Estimates Committee (CEC) was used in order to calculate the current regional carbon emissions for each region.
Grain SA sourced existing production practice data from the different agribusinesses in the Western Cape. The main participants who collaborated with production cost information for the different systems were Kaap Agri (Swartland), Overberg Agri (Southern Cape) and SSK (Southern Cape).
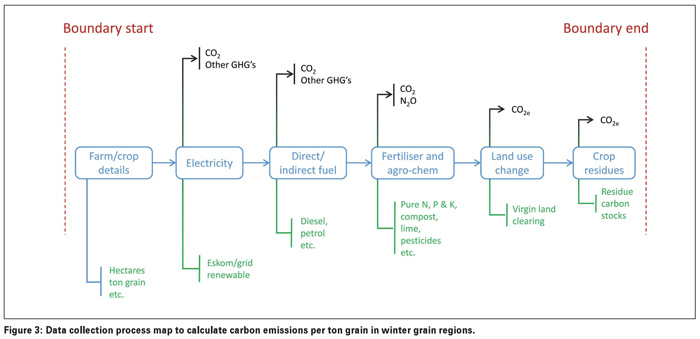
Figure 3 illustrates the data collection process with all the different production inputs collected to calculate the carbon emissions per ton grain.
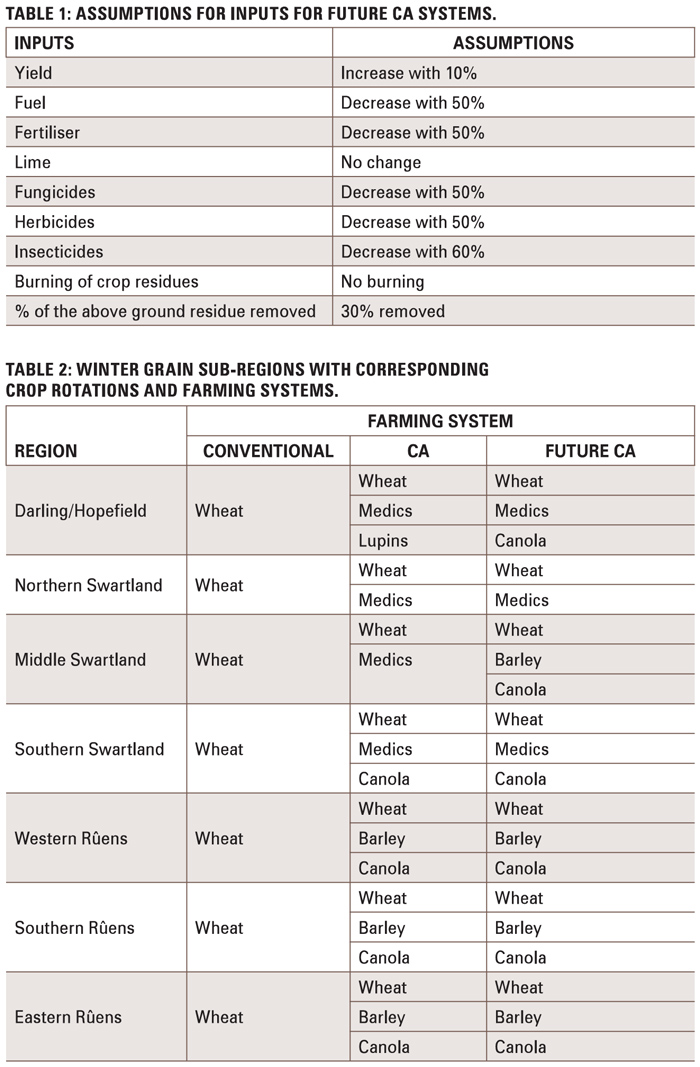 In addition to the existing data, Grain SA had discussions with CA researchers from the Western Cape (dr Johann Strauss, personal communication) for making realistic assumptions regarding production inputs under an ideal future CA scenario (see Table 1).
Table 2 illustrates the three different grain farming systems with their crop rotations in the region. In the conventional system only, wheat is cultivated each year while different crops are planted in rotation with each other in the current CA and future CA systems. The transition from the CA to the future CA system sees a change in the commodities cultivated in the Swartland regions but no change in the Rûens regions.
Results
The results are presented per farming system (conventional, current CA and future CA). In addition to the carbon emissions per ton grain results, the hotspots for the current and future scenarios on farms are presented.
Carbon emissions profile per farming system
The carbon emissions per ton wheat are presented in Graph 1. Wheat is the only grain grown under all three systems (Table 2) and therefore this comparison could be performed.
The results indicated that there was a 46% decline in carbon emissions per ton grain with the transition from conventional to future CA and a 44% decline from current CA to future CA. There is only a small difference in carbon emissions between conventional and current CA (3,5%) due to very similar input amounts and yields.
Carbon emissions profile for current scenario
Weighted average carbon emissions based on the total yields (tonnes) under conventional and current CA per sub-region are presented in Table 3.
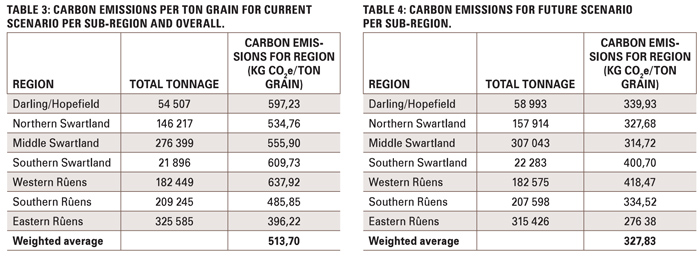
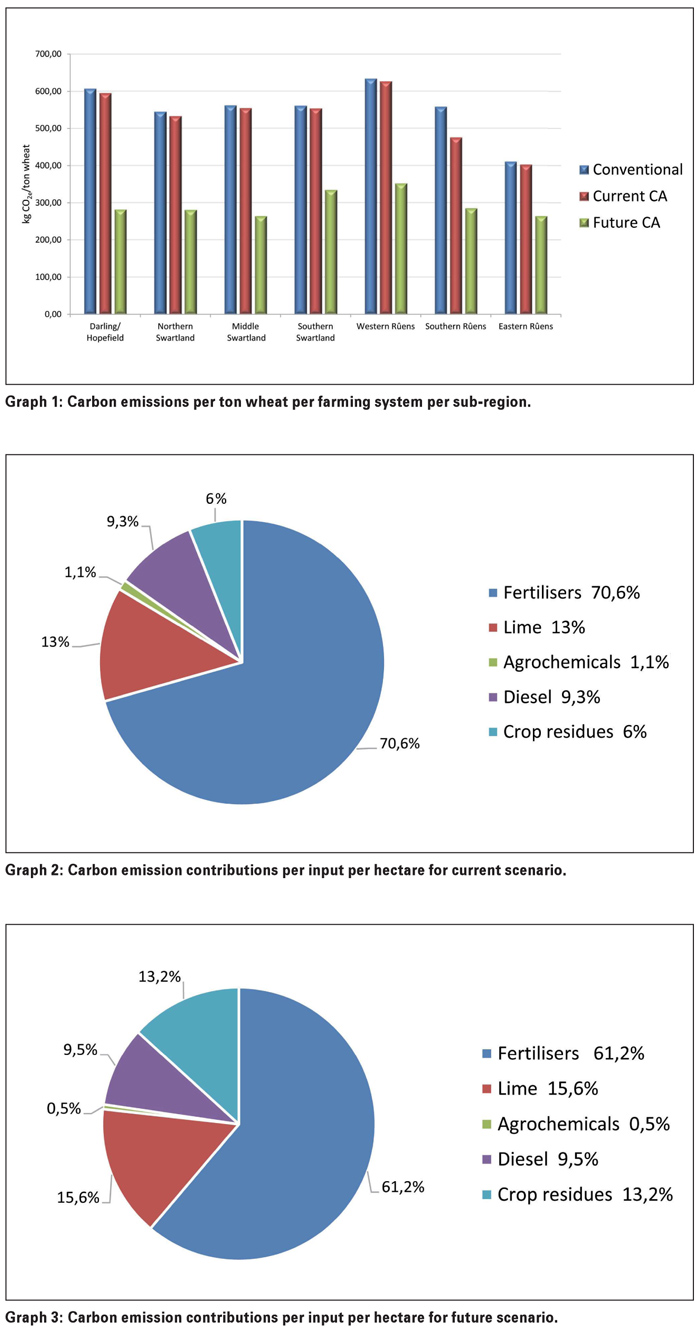 The overall carbon emissions under the current scenario is 513,70 kg CO2e/ton grain. The carbon emission hotspot profile per hectare for the current scenario is presented in Graph 2. It is evident that the farming input with the largest contribution to overall carbon emissions is fertiliser use, but more specifically synthetic nitrogen, which makes up 90% of the total fertiliser carbon emissions at 757 kg CO2e/ha out of a total of 1 182 kg CO2e/ha.
Using the total predicted tonnages for grains under the current CA and future CA systems, the future weighted average snapshot carbon emissions per ton grain for the winter grain region is predicted to be 328 kg CO2e/ton grain. The results per sub-region are presented in Table 4.
The carbon emission hotspot profile per hectare for the future scenario is shown in Graph 3. Fertiliser use is the largest contributor or hotspot to total carbon emissions per hectare followed by lime and crop residues. This profile is the same as for the current scenario but total greenhouse gas emission per hectare are significantly lower at 811 kg CO2e/ha.
Conclusion
It is evident that there will be a significant decrease in carbon emissions in the winter grains industry with the transition to the future CA systems as well as other environmental, economic and social benefits including the protection of biodiversity, increase in net yields and farm income and improving human nutrition (Putter, Smith and Lange, 2014).
From the perspective of the climate change impact, the transition to a higher level and quality of CA (defined here as future CA) is highly beneficial for the winter grain region in the Western Cape. The synergies between the future CA farming system and the environmental, economic and social benefits will ensure the sustainability of future grain cultivation in the region.
References
Earth System Research Laboratory. n.d. Trends in atmospheric carbon dioxide. Retrieved from: https://www.esrl.noaa.gov/gmd/ccgg/trends/global.html.
IPCC. 2007. IPCC Annex I: AR4 Appendix. Retrieved from: http://unfccc.int. [2018, August 23].
Putter, T, Smith, H and Lange, D. 2014. Transforming the benefits of conservation agriculture into a pro-CA Manifesto. Retrieved from: http://www.grainsa.co.za/transforming-the-benefits-of-conservation-agriculture-into-a-pro-ca-manifesto2 [2017, August 10].
Publication: January 2019
Section: On farm level


