

September 2015
JOLANDA NORTJÉ, manager: Laboratory, The Southern African Grain Laboratory NPC
Of the 150 samples analysed for the purpose of this third annual crop quality survey, 88% (132) were graded as Grade SB1, and 18 of the samples were downgraded to Class Other Soya Beans (COSB). During the previous two seasons, 5% (2012/2013) and 15% (2011/2012) of the samples were downgraded to COSB.
Nine of the 18 samples were downgraded as a result of the percentage other grain (mainly wheat and sorghum) present in the samples exceeding the maximum permissible deviation of 0,5%. Four of the samples were downgraded as a result of the presence of poisonous seeds (Crotalaria sp., Datura sp., Ricinis communis) exceeding the maximum permissible number, namely one per 1 000 g.
The remaining five samples were downgraded as a result of a combination of one or more of the following deviations exceeding the maximum permissible deviation: Percentage foreign matter, other grain, sunflower seed, defective soybeans on the 4,75 mm round hole sieve, poisonous seeds and undesirable odour.
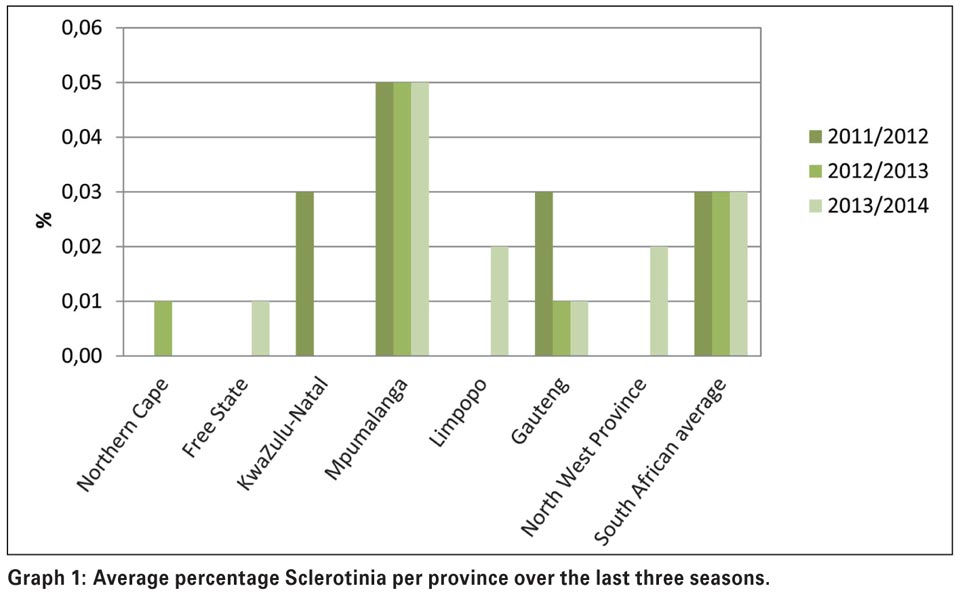
Based on the samples received for this crop survey, Sclerotinia did not pose any problems. Sclerotinia sclerotiorum, a fungus that produces hard masses of fungal tissue, is also known as Sclerotinia. The sclerotia consisting of a dark black exterior, a white interior and a rough surface texture, varies in size and form. Besides seed yield reductions, the disease also results in reduced seed quality and seed contaminated with the black sclerotia of the fungus.
The highest percentage of Sclerotinia observed (0,40%) was on a sample from Mpumalanga, which is still well below the maximum permissible level of 4%. Over the last three seasons, Mpumalanga consistently had the highest weighted average percentage of Sclerotinia compared to the other provinces. The national weighted average percentage over the last three seasons was 0,03%.
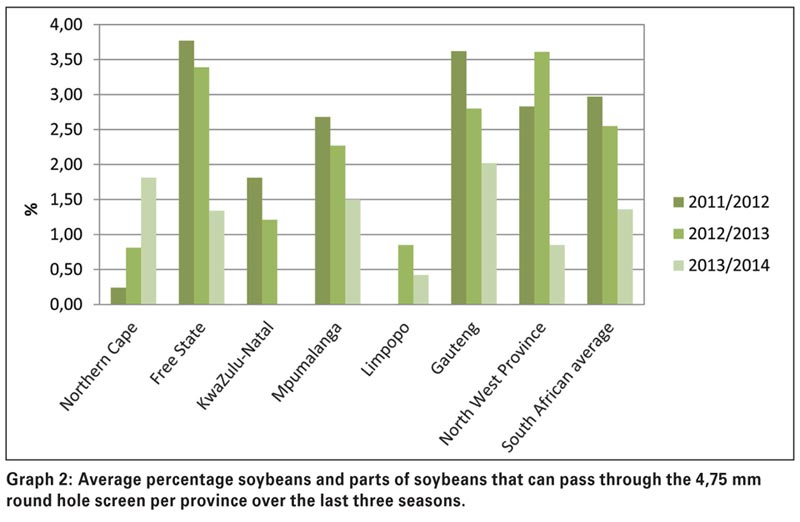
Gauteng province (seven samples) reported the highest weighted average percentage soybeans and parts of soybeans that can pass through the 4,75 mm round hole screen, namely 2,02% and Limpopo (three samples) the lowest at 0,42%. Mpumalanga, with the highest number of samples (67), reported an average of 1,50%. The Free State averaged 1,34% (51 samples). The national weighted average percentage over the last three seasons decreased from 2,97% in the 2011/2012 season to 1,36% this season. No samples were received from KwaZulu-Natal for the 2013/2014 season.
The weighted average percentage soiled soybeans of 0,89% is higher than the 0,41% of the previous season, but well below the weighted average (1,60%) of the 2011/2012 season. This season, only six samples in total had soiled soybean percentages exceeding 5% and none exceeded the maximum permissible deviation of 10%.
Hectolitre mass (test weight) does not form part of the grading regulations for soybeans in South Africa. An approximation of the hectolitre mass of South African soybeans is provided in Table 1 for information purposes.
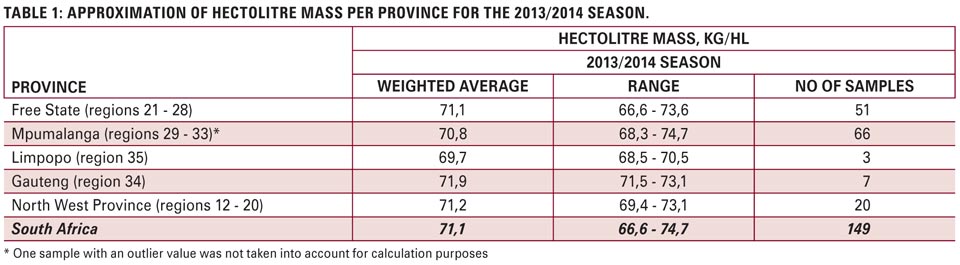
The grams per 1 litre of filling weight of the 150 soybeans samples were determined by means of the Kern 222 apparatus. The hectolitre mass was extrapolated by following the formulas obtained from the Test Weight Conversion Chart for Soybean of the Canadian Grain Commission.
These are: y = 0,1898x + 2,2988 (291 to 350 g/0,5 L) and y = 0,1895x + 2,3964 (351 to 410 g/0,5 L).
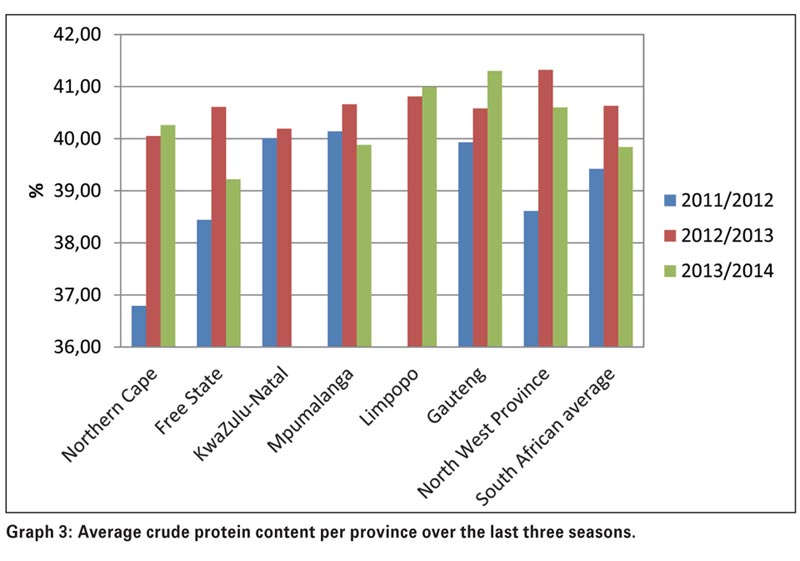
The protein, fat and ash components are reported as % (g/100 g) on a dry/moisture free basis. The average crude protein content of the 2013/2014 season was 39,84% – 0,79% lower than the 40,63% of the previous season.
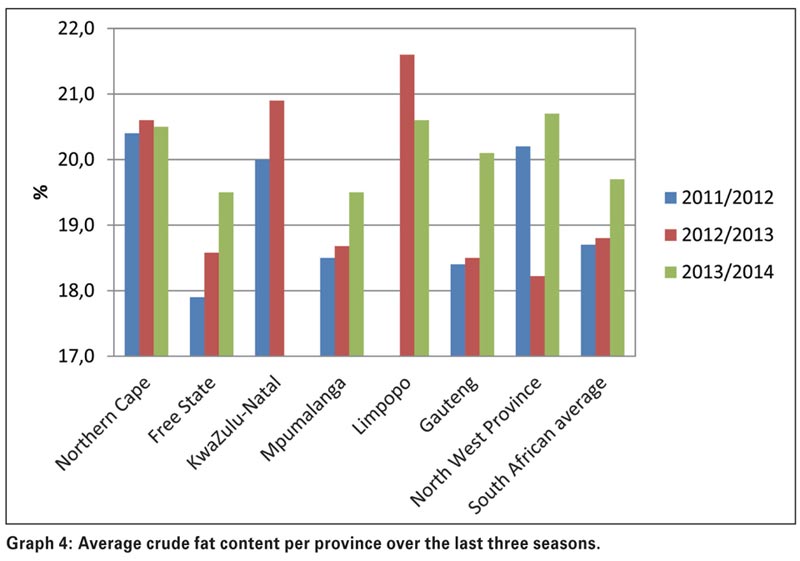
Gauteng showed the highest weighted average crude protein content of 41,30% and the Free State the lowest of 39,22%, followed by Mpumalanga with 39,88%. The average crude fat percentage increased from 18,8% in 2012/2013, to 19,7% this season.
The samples from the North West Province had the highest weighted average crude fat content of 20,7%. The lowest average fat contents were observed in the Free State and Mpumalanga, both with 19,5%.
The national weighted average ash content did not vary significantly over the last three seasons, with 4,66% this season compared to the 4,65% and 4,62% of the previous two seasons. Samples from the Northern Cape and Limpopo tend to show higher ash contents, while those from Mpumalanga tend to be lower. The weighted average percentage crude fibre varied from 5,4% in the Northern Cape to 6,3% in the Free State and Mpumalanga. The South African weighted average was 6,1%.
All 15 samples tested for genetic modification (GM) by means of the EnviroLogix QuickComb kit for bulk soybeans, tested positive for the presence of the CP4 EPSPS trait (Roundup Ready®).
Detailed results of this survey as well as that of the previous two seasons are available on the SAGL website (www.sagl.co.za). The annual crop quality reports in PDF format are also available to download from the website.
With gratitude to the Oil & Protein Seed Development Trust for financial support of these annual surveys and to the members of Agbiz Grain for providing the crop samples.
Publication: September 2015
Section: Relevant


