manager: Laboratory, The Southern African Grain Laboratory NPC
In the sixth annual sunflower crop quality survey that was performed by the Southern African Grain Laboratory (SAGL), 176 crop samples representing the various production regions were tested. Samples, provided by members of Agbiz Grain, were forwarded to SAGL by commercial grain silo owners and received from July to November 2018.
Test weight
The average test weight (a measure of the bulk density) of sunflower seed for this season was 40,1 kg/hl, ranging between 33,2 kg/hl and 45,9 kg/hl. The previous two seasons averaged 42,1 kg/hl and 42,5 kg/hl respectively, with values varying between 34,2 kg/hl and 45,5 kg/hl and 35 kg/hl and 48,1 kg/hl.
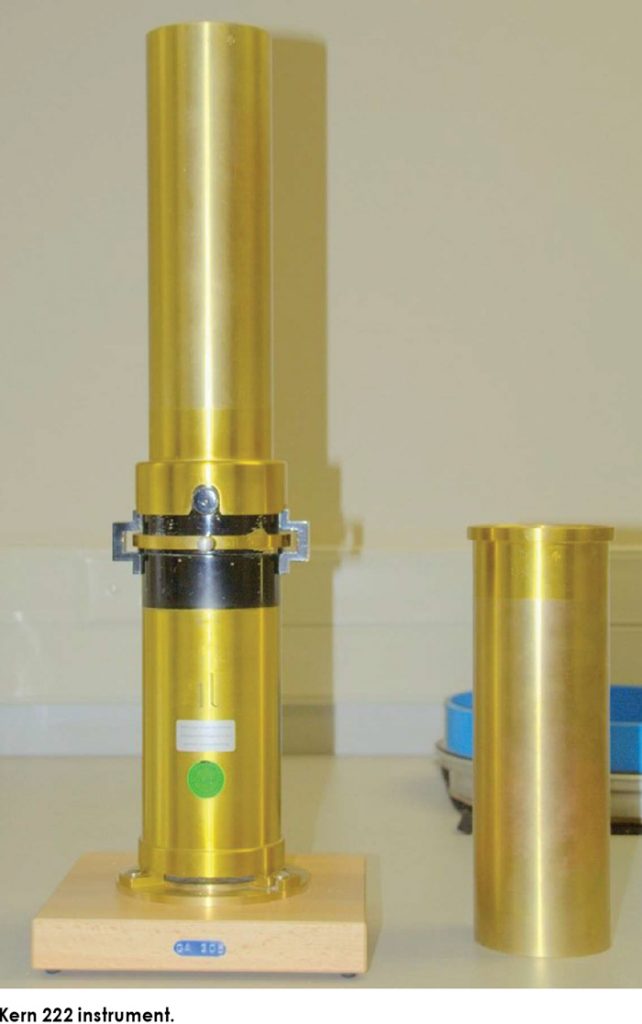
These values were determined by following the standard working procedure for the Kern 222 instrument, as described in ISO 7971-3:2009, to obtain the g/1 litre filling mass of the sunflower seed samples, which was then divided by two. The g/½ litre filling mass thus obtained, was then used to extrapolate the test weight by means of formulas obtained from the Test Weight Conversion Chart for Sunflower Seed Oil of the Canadian Grain Commission.
Quality – grading
Full grading was done in accordance with the regulations relating to the grading, packing and marking of sunflower seed intended for sale in the Republic of South Africa (Government Notice No. 45 of 22 January 2016). 143 (81%) of the samples were graded as Grade FH1, while 33 samples were downgraded to Class Other Sunflower Seed (COSF). During the previous two seasons, 15% (2016/2017) and 22% (2015/2016) of the samples were downgraded to COSF.
The majority of samples (18) downgraded this season was as a result of the percentage of either the screenings or the collective deviations or a combination of both exceeding the maximum permissible deviations of 4% and 6% respectively. A further nine samples were downgraded due to the presence of poisonous seeds (either Datura spp., Crotalaria spp. or Xanthium strumarium) exceeding the maximum permissible number.
North West (99 samples) reported the highest weighted average percentage screenings namely 2,18%, followed by Limpopo (five samples) and the Free State (64 samples) with 1,84% and 1,56% respectively. Mpumalanga (eight samples) reported the lowest average percentage screenings of 1,33%. The weighted national average was 1,91% compared to the 2,18% of the previous season. No samples were received from Gauteng this season.
The highest weighted percentage foreign matter (1,4%) was reported on the samples from the Free State. The North West Province averaged 1,06% and the lowest percentages were found in Limpopo and Mpumalanga with 0,68% and 0,66% respectively. The South African average was 1,16% compared to the 1,06% and 1,41% of the previous two seasons.
Sclerotinia
The number of samples received for this survey that contained sclerotia from the fungus Sclerotinia sclerotiorum, almost tripled from 28 samples (16%) in the previous season to 78 samples (44%) this season. 41 of these samples originated in the North West Province, 28 in the Free State, eight in Mpumalanga and one in Limpopo.
However, none of these samples exceeded the maximum permissible deviation of 4%. Weighted average levels ranged from 0,02% in Limpopo to 0,36% in Mpumalanga. The national average of 0,17% was slightly higher than the 0,11% of the previous season.
 According to an article published by researchers of the Department of Plant Sciences: Plant Pathology Division of the University of the Free State, there are currently no commercially available sunflower or soybean cultivars worldwide that are resistant to the fungus (pathogen). The manner in which sunflower and soybean cultivars differ in their response to the pathogen under disease-favourable conditions, enables farmers to select cultivars that are more tolerant. This reduces the risk of infection, yield losses and inoculum build-up in the fields.
Quality – nutritional content
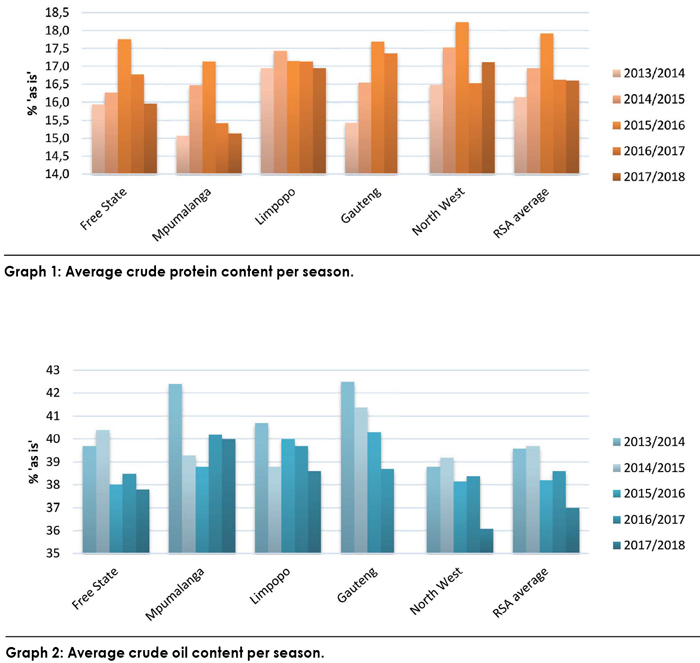
The weighted average crude protein content (total nitrogen content x 6,25) was 16,61% – similar to the 16,63% of the previous season. The North West Province had the highest weighted average crude protein content of 17,12% and Mpumalanga the lowest with 15,15%.
Mpumalanga has consistently reported the lowest average protein content since commencement of this survey in the 2012/2013 season. Limpopo’s crude protein content averaged 16,95% and that of the Free State 15,97%. Please refer to Graph 1 for the average crude protein content per province over the last five seasons.
The weighted average crude oil percentage of 37% was the lowest of the last six seasons and 1,6% lower than the previous season. Mpumalanga had the highest weighted average crude oil content of 40%. Last season Mpumalanga also reported the highest oil content. The lowest average oil content was the 36,1% of the North West Province (also the lowest in the previous season). Please see Graph 2.
However, the weighted average percentage crude fibre was the highest of the six seasons at 21,9% (21% in 2016/2017). Average values varied between 20,2% in Limpopo to 22,2% in the Free State. The weighted average ash (mineral matter) content is also the highest over six seasons (2,69%), last season being 2,52%. The provincial averages ranged from 2,56% in Mpumalanga to 2,74% in Limpopo. The nutritional component analyses are reported as percentage (g/100 g) on an ‘as received’ or ‘as is’ basis.
 Production overview
World sunflower seed production in the 2017/2018 season decreased by 1% year on year to 49,6 million tons. The local crop followed the same trend, decreasing by 1,4% (12 000 tons) to 862 000 tons.
Globally, the Ukraine and Russia are the main sunflower producing countries, while in South Africa the Free State and the North West Province contributed 95% of the total crop. World sunflower seed production figures were obtained from the National Sunflower Association’s website (www.sunflowernsa.com) and national figures from the Crop Estimates Committee (CEC) of the Department of Agriculture, Forestry and Fisheries (now Agriculture, Land Reform and Rural Development).
The area utilised for sunflower production decreased by 5,4% to 601 500 ha, compared to the 635 700 ha of the previous season. This season’s area planted is in line with the five-year average of 606 780 ha.
South Africa’s national yield average increased by 4,4% to 1,43 t/ha, the highest national average to date. Less than 1,5% of the sunflower seed produced in the country this season was planted under irrigation.
Visit our website (www.sagl.co.za) to view the annual national crop quality reports which are available from the 2012/2013 season. The reports are also available for download in a PDF format.

