October 2015

WANDILE SIHLOBO, economist: Grain SA and TINASHE KAPUYA, head: Trade and Investment, Agbiz
The significance of China in grain and oilseed global markets
China continues to be an important player in the grain markets, particularly when referring to demand. The country is the second largest cereal (grain) importer, accounting for 6% of the global traded cereals in 2014. Moreover, China is also a leading importer of oilseeds, accounting for 42% of the global traded oilseeds in 2014.
Hence, the current economic slowdown has caused major concerns in the grain markets, which has led to increased volatility in prices. In this article, we will briefly explore the Chinese grain and oilseed market structure, in a view to present its significance in the global grain and oilseed markets (which also influences the South African grain and oilseed markets).
Chinese cereal (grain) import perspective
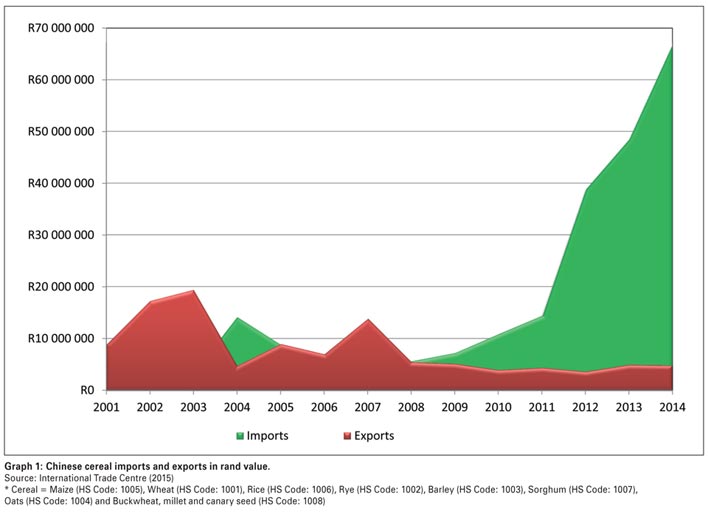
China has been the net importer of cereal since 2008, with imports increasing significantly between 2009 and 2014, from R7,3 billion to R67 billion. Although various factors contributed to this increase, the most significant has been an increased consumption in the feed industry, which in turn has been driven by a high demand for protein diets and an ever increasing (middle-class) population. Graph 1 illustrates Chinese imports and exports between 2001 and 2014.
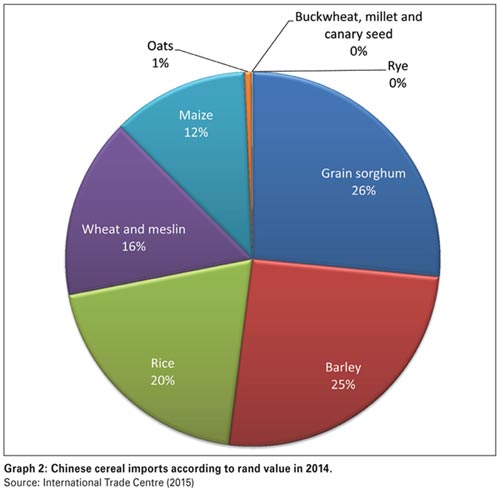
In 2014, the leading cereal suppliers to the Chinese market were the United States, with a share of 34%, Austria supplying 28%, Vietnam 10%, Thailand 8%, Canada 5%, the Ukraine 5%, France 4%, Pakistan 3% and Kazakhstan 1%. Graph 2 illustrates imported commodities for 2014.
Within the cereal basket, grain sorghum continues to be the largest imported commodity in China, accounting for 26% (5,7 million tons) of the cereal basket in 2014. Barley was the second largest imported commodity, accounting for 25% (5,4 million tons), followed by rice, accounting for 20% (2,9 million tons). Wheat (and meslin) and maize accounted for 16% (2,6 million tons) and 12% (2,5 million tons), respectively, with the remaining commodities accounting for a mere 138 362 tons.
Even though China is a net importer of cereals, the country also exports rice (an average of 462 311 tons in the past five years), maize (an average of 123 641 tons in the past five years), wheat (an average of 10 818 tons in the past five years) and sorghum (and average of 35 343 tons in the past five years).
Chinese oilseed import perspective
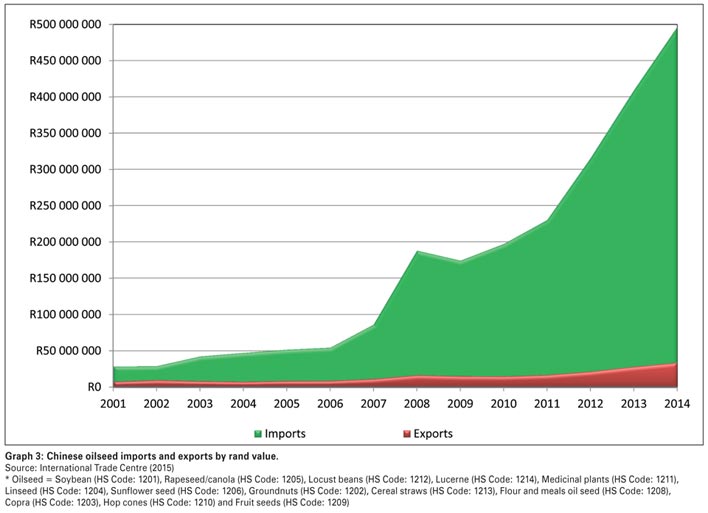
China is also a net importer of oilseeds. Between 2011 and 2014, imports have grown exponentially, from R230 billion to R497 billion.
Increasing demand from both the feed industry as well as human consumption are two major drivers of this growth, which are underlined by an advancing agro-processing sector and an increasing population, respectively. Graph 3 illustrates the Chinese oilseed imports and exports trend.
 In 2014, the leading suppliers to the Chinese oilseed market were Brazil, with a share of 41%, followed by the United States with 37%, Argentina and Canada with 7% each and Uruguay with 3%.
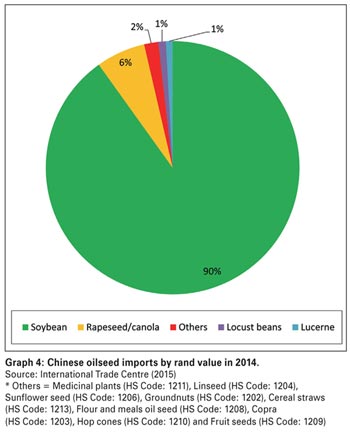
Soybean is the largest imported commodity, accounting for 90% (71,4 million tons) of imported oilseeds in 2014. Graph 4 illustrates Chinese oilseed imports by product in 2014.
The second largest imported commodity in 2014 was canola (rapeseed), accounting for 6% (5,08 million tons) of the oilseed market. The third and fourth largest imported commodities were locust beans and lucerne, both accounting for 1% (1 348 496 tons and 1 007 446 tons, respectively). Chinese sunflower seed imports accounted for a mere 62 385 tons, followed by groundnuts imports of 29 886 tons.
Concluding remarks
The above presented the significance of China in the oilseed and grain markets. Given the share of this country in the global market, it is reasonable to be concerned about their future demand should the economic slowdown affect consumption.
A decrease in Chinese demand would add pressure on global cereal and oilseed prices which in turn might influence local prices, and consequently our local producers. Indications thus far show that the soft commodities demand in China is mixed.
On the one hand, the United States Department of Agriculture’s September 2015 World Agricultural Supply and Demand Estimates showed increased Chinese 2015/2016 soybean imports, which are expected to reach 79 million tons – this is higher than the 2014 estimate of 71 million tons.
On the other hand, the same report points to comparatively lower 2015/2016 Chinese maize imports – which are forecasted at 1,5 million tons, compared to the 2014 imports of 2,6 million tons. The 2015/2016 Chinese wheat imports were forecasted at 2,2 million tons, lower than the previous year’s imports of 2,6 million tons.
However, the decrease in maize and wheat imports is not because of the economic slowdown, but rather due to an increase in the domestic production. It is important to note that these estimates might be revised in the following month and we will continue to communicate the developments.
Publication: October 2015
Section: On farm level


