


October 2016
JOLANDA NORTJÉ, manager: Laboratory, The Southern African Grain Laboratory NPC
The final commercial sunflower crop figure of the 2014/2015 season, as overseen by the National Crop Estimates Liaison Committee, is 663 000 tons. The crop decreased by 20% (169 000 tons) compared to the 2013/2014 season as a result of drought conditions experienced.
The area utilised for sunflower production decreased by almost 4% from 598 950 ha in the previous season to 576 000 ha this season. The yield decreased from 1,39 t/ha to 1,15 t/ha. The major sunflower-producing provinces, namely the Free State and North West, contributed 89% of the total crop.
During the 2015 harvesting season, a representative sample of each delivery of sunflower at the various silos was taken according to the prescribed grading regulations. 176 composite sunflower samples, representing the different production regions, were analysed for quality. The results were published in the third annual sunflower crop quality report.
Summary of results
Full grading was done in accordance with the regulations relating to the grading, packing and marking of sunflower seed intended for sale in the Republic of South Africa (No. R 45 of 22 January 2016). 86% (151) of the 176 samples analysed for the purpose of this survey were graded as grade FH1 and 25 of the samples were downgraded to ‘class other sunflower seed’ (COSF).
 The majority of the samples downgraded, were as a result of the percentage of either the screenings or the collective deviations or a combination of both exceeding the maximum permissible deviations of 4% and 6% respectively. The percentage of FH1 samples showed an increase compared to the 82% and 80% of the 2013/2014 and 2012/2013 seasons respectively.
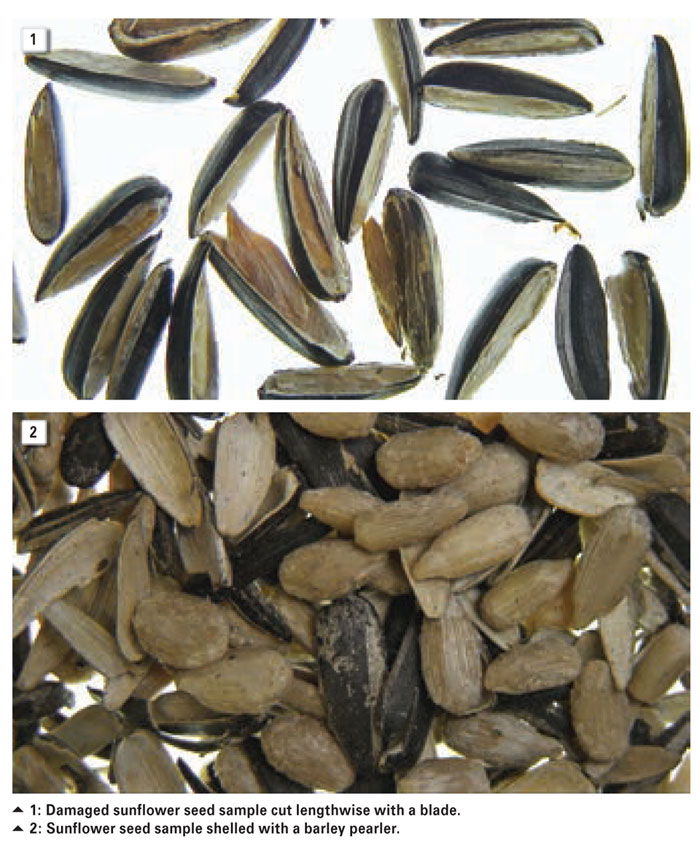
According to the grading regulations, the determination of damaged sunflower seed is done on a 20 g working sample, obtained from a screened sample free of foreign matter and sclerotinia. This 20 g sample is then shelled to retain the nucleus portion of the seeds. Consequently, the grading of sunflower seed is a tedious and time-consuming process.
20 g of an average sunflower sample consists of approximately 462 sunflower seeds as counted on a Numigral seed counter. Cutting each kernel in the sample lengthwise in half with a carpet knife blade to enable inspection of the nucleus, typically takes a grader more than 20 minutes.
As an alternative to hand shelling, the SAGL investigated the effectiveness of a barley pearler to shell the sunflower seeds. To shell a 20 g sample using the barley pearler takes less than two minutes. Based on this positive outcome, the SAGL has purchased a barley pearler, which will assist among other things with more timeous publication of crop survey grading results to our website. See Photo 1 and Photo 2.
The national weighted average percentage damaged sunflower seed this season was 0,27%. The previous two seasons averaged 1,06% and 0,61% respectively.
Damaged sunflower seed by definition means sunflower seed or portions thereof which is visibly discoloured as a result of external heat or heating due to internal fermentation.
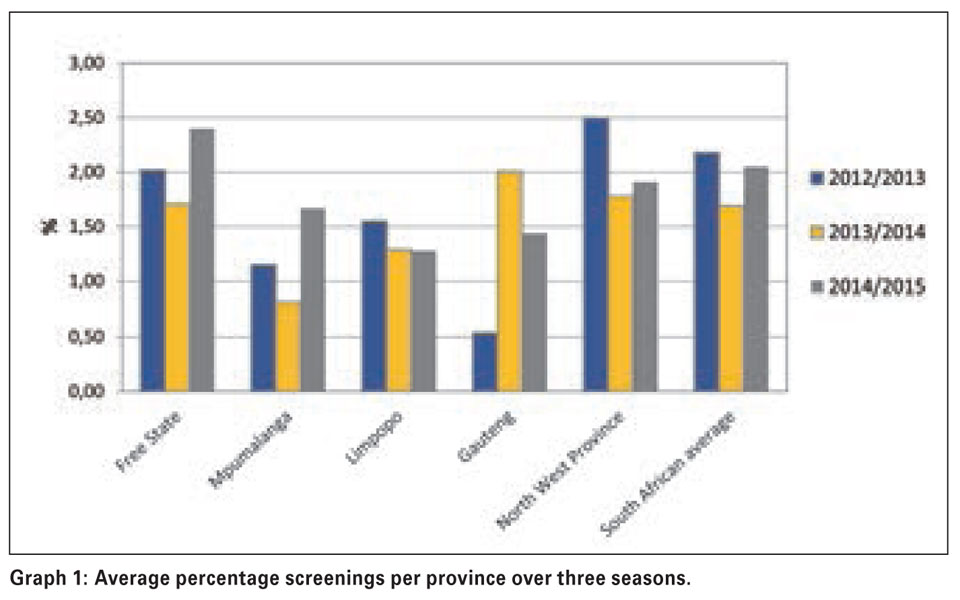
The Free State (69 samples) reported the highest weighted average percentage screenings, namely 2,40%, followed by North West (N = 86) and Mpumalanga (N = 98) with 1,91% and 1,67% respectively.
Limpopo (eight samples) reported the lowest average percentage screenings of 1,28%. The weighted national average was 2,05% compared to the 1,69% of the previous season. See Graph 1.
As in the previous season, the highest weighted percentage foreign matter (2,18%) was reported for the samples from Gauteng (N = 5). The Free State and North West averaged 1,15% and 1,16% respectively. The lowest average percentage was found in Limpopo at 0,71%. The South African average of 1,17% was the lowest of the last three seasons.
Sclerotinia did not pose a problem on any of the samples received for this survey and was observed on only eight of the samples. The highest percentage (3,03%) was present on a sample from Gauteng, this is, however, still well below the maximum allowable level of 4%. Sclerotinia was not observed on any of the samples from Limpopo. Weighted averages ranged from 0,01% in the North West to 0,02% for both the Free State and Mpumalanga.
Gauteng showed the highest weighted average of 1,01%. The national average of 0,04% compared well with the 0,01% of the 2012/2013 season and was lower than the 0,53% of the previous season.
Test weight, providing a measure of the bulk density of grain and oilseeds, does not form part of the grading regulations for sunflower seed in South Africa. An approximation of the test weight of South African sunflower seeds was done by determining the g/1 L filling weight of sunflower seed by means of the Kern 222 apparatus.
The test weight was then extrapolated by means of the following formulae obtained from the test weight conversion chart for sunflower seed oil of the Canadian Grain Commission: y = 0,1936x + 2,2775 (138 to 182 g/0,5 L) and y = 0,1943x + 2,1665 (183 to 227 g/0,5 L).
The national weighted average test weight was 44,2 kg/hl, compared to the 41,3 kg/hl and 43,4 kg/hl of the previous two seasons. Values ranged from 34 kg/hl to 50,5 kg/hl this season. Provincial averages varied from 41,9 kg/hl in Mpumalanga to 44,8 kg/hl in Gauteng. All of the sunflower samples were milled on a Retch ZM 200 mill fitted with a 1 mm screen, prior to nutritional component analyses. The crude protein, -fat, -fibre and ash components are reported as % (g/100 g) on an ‘as received’ or ‘as is’ basis.
The Dumas combustion analysis technique was used to determine the crude protein content, according to AACCI method 46-30,01, latest edition. Combustion at high temperature in pure oxygen sets nitrogen free, which is measured by thermal conductivity detection. The total nitrogen content of the sample is determined and converted to equivalent protein by multiplication with a factor of 6,25 to obtain the crude protein content.
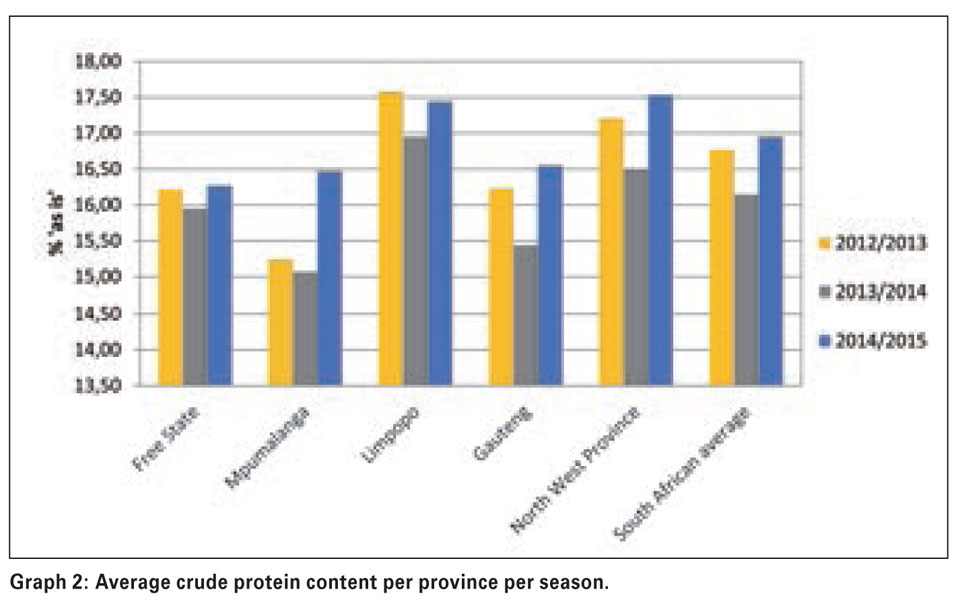
The weighted average crude protein content of the 2014/2015 season was 16,96% – 0,81% higher than the previous season and 0,17% higher than in the 2012/2013 season. The North West had the highest weighted average crude protein content of 17,53% and the Free State the lowest with 16,27%. See Graph 2.
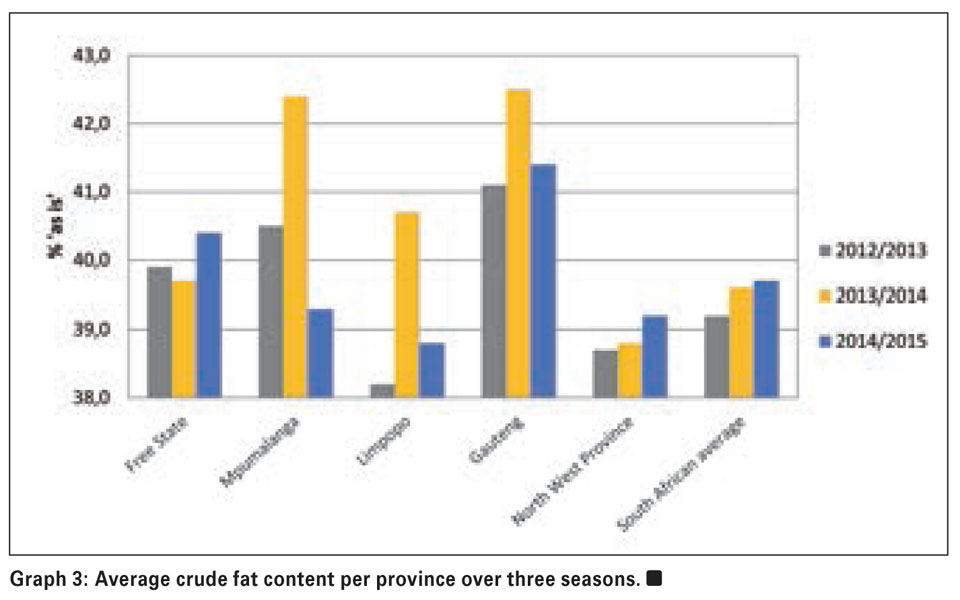
Fat is extracted by petroleum ether with the aid of the Soxhlet extraction apparatus, followed by the removal of the solvent by evaporation and weighing the dried residue thus obtained. The weighted average crude fat percentage of 39,7% compared very well with the 39,6% and 39,2% of the two previous seasons. Gauteng had the highest weighted average crude fat content of 41,4%. The lowest average fat content was observed in Limpopo (38,8%). The North West and the Free State averaged 39,2% and 40,4% respectively (Graph 3).
The weighted average percentage crude fibre decreased slightly from 20,2% in the previous season to 20% this season and equalled the 2012/2013 value. The values varied between 19,1% in Gauteng to 20,7% in Mpumalanga. The in-house method used determines crude fibre as the loss on ignition of the dried residue remaining after digestion of the sample with 1,25% sulphuric acid (H2SO4) and 1,25% sodium hydroxide (NaOH) solutions under specific conditions.
Ash is defined as the quantity of mineral matter which remains as incombustible residue of the tested substance, after application of the described working method. SAGL uses an in-house method, based on AACCI method 08-03.01. The samples were incinerated at 600 ± 15°C in a muffle furnace for two hours. The national weighted average ash content is slightly lower (2,55%) than last season (2,66%) but similar to 2012/2013 (2,54%). The provincial averages ranged from 2,45% in Gauteng and Mpumalanga to 2,58% in the Free State.
The results of this survey are available on the SAGL website (www.sagl.co.za). The hard copy reports are distributed to all the directly affected groups and interested parties. The report is also available for download in a PDF format from the website.
With gratitude to the Oil & Protein Seed Development Trust for the financial support of these annual surveys and to the members of Agbiz Grain for providing the crop samples.
Publication: October 2016
Section: Relevant


