

August 2015
JOLANDA NORTJÉ, laboratory manager: The Southern African Grain Laboratory NPC
During the 2014 harvesting season (April to August), a representative sample of each delivery of maize at the various silos was taken according to the prescribed grading regulations and forwarded to the Southern African Grain Laboratory (SAGL).
A total of 930 composite samples, representing white (451) and yellow (479) maize of each production region, were received and analysed for quality. The major maize producing provinces were the Free State, North West Province and Mpumalanga, contributing 84% of the total maize production in South Africa.
Yellow maize contributed 67% of the total maize production in Mpumalanga while the majority of maize produced in the Free State and especially the North West Province is white.
Maize crop quality 2013/2014 – summary of results
South African grading
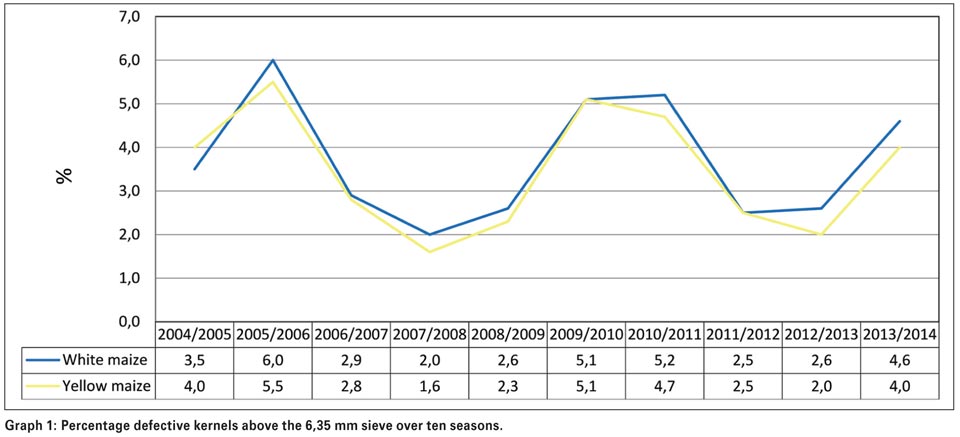
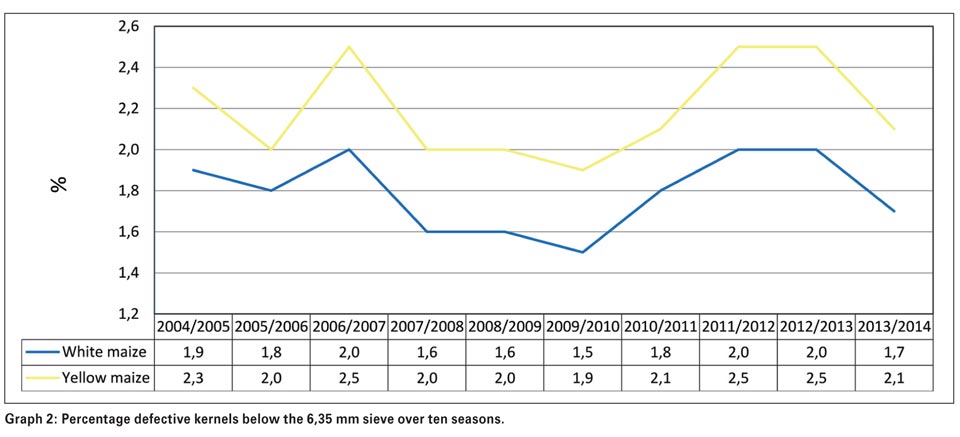
The maize crop was of good quality, with 70% white and 77% yellow maize, graded as maize grade one. The percentage total of defective kernels above and below the 6,35 mm sieve (6,2% for white and 6,1% for yellow) compared well, but was higher than the previous two seasons.
The percentage defective kernels above the sieve increased, compared to the two previous seasons, but the percentage defective kernels below the sieve decreased. Both the percentage of Diplodia and Fusarium infected kernels were 0,4% higher than the previous season’s 0,6% and 1,1% respectively. Foreign matter and differently coloured maize did not pose significant problems.
The average percentage combined or total deviations of white maize were 6,8% compared to the 4,9% of the 2012/2013 season; that of yellow maize was also higher – 6,4% compared to 4,8%. The average percentage of total deviations on South African maize this season was 1,7% higher than the previous season.
USA grading
Of the 930 maize samples graded according to USA grading regulations, 42% were graded US1, 31% US2, 11% US3, 7% US4, 6% US5 while mixed and sample grade represented 1% and 2% respectively.
The percentage samples graded as US1 was significantly lower than the 79% of the previous season. The percentage samples graded as US2 was significantly higher than the 13% of the previous season. The main reason for downgrading the samples was the percentage total damaged kernels exceeding the maximum limit per grade.
Physical quality factors
Hectolitre mass or bushel weight or test weight is applied as a grading factor in the USA grading regulations, but also done routinely at most intake points locally.
White maize had an average hectolitre mass of 77,6 kg/hl compared to the 76 kg/hl of yellow maize. The hectolitre mass in total varied from 56,6 kg/hl to 81,9 kg/hl and averaged 76,8 kg/hl, slightly lower than the ten year average. Only 28 samples reported values below the minimum requirement (56 lbs or 72,1 kg/hl) for USA grade one maize – 15 of these samples were from Mpumalanga and eight from the Free State.
The 100 kernel mass averaged 32,9 g which is 3,9 g higher than the previous season and also 0,6 g higher than the ten year average. White maize averaged 34 g and yellow maize 31,8 g.
The kernel size of both white and yellow maize was larger than the previous two seasons. The percentage of yellow maize kernels above the 10 mm sieve were on average 9,8% lower than white kernels and the percentage of kernels below the 8 mm sieve were 7,4% higher than that of white maize.
The breakage susceptibility of both white and yellow maize compared well with the 2012/2013 season, although slightly higher. The percentage stress cracks varied from 0% to 53%, averaged 7% and was also slightly higher than in previous seasons.
The milling index varied from 46,5 to 120,4 and averaged 90,9 – 4,2 lower than the previous season. The average milling index for white maize is higher (93) than that of yellow maize (89).
Roff milling and whiteness index (WI)
The average percentage extraction of total meal in white maize obtained with the Roff mill averaged 79% (0,2% higher than the previous season) and varied from 73,5% to 84,8%.
The whiteness index averaged 25,3 for unsifted and 15,6 for sifted maize meal. Sieving the sample eliminates differences in the readings as a result of particle size. The whiteness index of the previous season averaged 25,1 for unsifted maize meal. Sifted maize meal averaged 15,9.
The higher the WI value obtained, the whiter the meal sample. The main contributing factors causing differences in WI values are the presence of other colour maize like yellow maize, the presence of defective kernels, the type of cultivar as well as the soil composition. The sample with the lowest sifted whiteness index of -18 this season also had the highest percentage of other maize namely 9,2%.
Nutritional values
The fat, starch and protein nutritional components are reported as percentage (g/100 g) on a dry base. In general, white maize tends to have a higher fat content than yellow maize, but a lower starch content. No clear trend can be observed with regards to the protein content.
The average fat content of the 2013/2014 crop samples was 3,9%, equal to the weighted ten year average and 0,1% lower than the 2012/2013 samples. The average protein content (8,6%) was equal to the weighted ten year average and 0,6% lower than the 9,2% of the previous season. The starch content this season increased on average with 1,4% compared to the 71,6% of the previous season and is also 0,6% higher than the ten year weighted average of 72,4%.
The fat content of white maize was slightly lower (0,1%) than the previous season and 0,2% higher than that of yellow maize. The protein content of white maize was equal to that of yellow maize (8,6%). The starch content of both white and yellow maize is higher than the previous season by 1,5% and 1,2% respectively.
Genetic modification (GM)
The SAGL used the EnviroLogix QuickComb kit for bulk grain to quantitatively screen 100 of the crop samples for the presence of the Cry1Ab, Cry2Ab and/or CP4 EPSPS traits. 96% of the samples tested positive for Cry1Ab, 90% tested positive for the Cry2Ab and 94% for the CP4 EPSPS trait.
Mycotoxins
Mycotoxin levels in grain are governed by two laws in South Africa: The Foodstuffs, Cosmetics and Disinfectants Act, 1972 (Act No. 54 of 1972) and the Fertilizers , Farm Feeds, Agricultural Remedies and Stock Remedies Act, 1947 (Act No. 36 of 1947). The first prescribes maximum levels for only total aflatoxin and aflatoxin B1 in food for human consumption. The latter prescribes maximum levels for aflatoxin B1, deoxynivalenol (DON), fumonisin B1, ochratoxin A and zearalenone in farm feeds (12% moisture content) according to the type and age of animal the feed is intended for.
None of the 350 samples tested positive for aflatoxin, ochratoxin A, HT-2 or T-2 toxin residues.
The average fumonisin level (sum of B1, B2 and B3) on all 350 samples tested was 186 μg/kg (ppb) and ranged from 0 (not detected [ND]) to 5 357 μg/kg. This average is lower than the previous season’s 257 μg/kg. Of the 350 samples tested, 143 samples (41%) tested positive for fumonisins and the average of these positive results was 456 μg/kg.
In the previous season, 45% of the samples tested positive, with an average of 571 μg/kg. Only one sample’s total fumonisin level was higher than the lowest maximum level allowed for fumonisin B1, namely 5 000 μg/kg for horses and pets, according to amendments published in Regulation No. R. 70, dated 12 February 2010 of Act 36 of 1947 Fertilizers, Farm Feeds, Agricultural and Stock Remedies. All of the fumonisin B1 levels were well below this limit.
The highest deoxynivalenol (DON) level detected was 6 134 μg/kg compared to the 617 μg/kg of last season. The average level of all samples tested this season was 289 μg/kg; 21 μg/kg the previous season.
9% of the samples tested positive for DON last season compared to 69% this season. The average of the positive results increased from 225 μg/kg in 2012/2013 to 417 μg/kg in 2013/2014. The maximum DON levels allowed according to Regulation R. 70, range from 1 000 μg/kg for pigs and pets to 5 000 μg/kg for cattle. Fifteen of the samples had levels higher than 1 000 μg/kg, of which two was between 2 000 and 3 000 μg/kg and only one exceeded the maximum level of 5 000 μg/kg.
17% of the samples tested positive for 15-acetyl-deoxynivalenol (15-ADON) residues, the average of the positive results was 182 μg/kg. Only one sample tested positive the previous season.
Zearalenone residues were found in 12% of the samples, values ranged from 0 (ND) to 445 μg/kg. The average of the positive samples was 78 μg/kg compared to the 31 μg/kg of the previous season when 2% of the samples tested positive. None of these values exceeded the lowest maximum content for zearalenone namely 500 μg/kg for cows and dairy cattle. A sample is seen as having tested positive when the value exceeds the lowest concentration level that can be quantified with acceptable precision and accuracy by the mass spectrometer instrument used by the SAGL. For the fumonisins and zearalenone, these levels are 20 μg/kg and for DON 100 μg/kg. The 2013/2014 average concentration levels of fumonisin and DON in South African commercial maize are six times lower than the average concentrations reported in maize in the 2014 Biomin Mycotoxin Survey report (www.biomin.net).
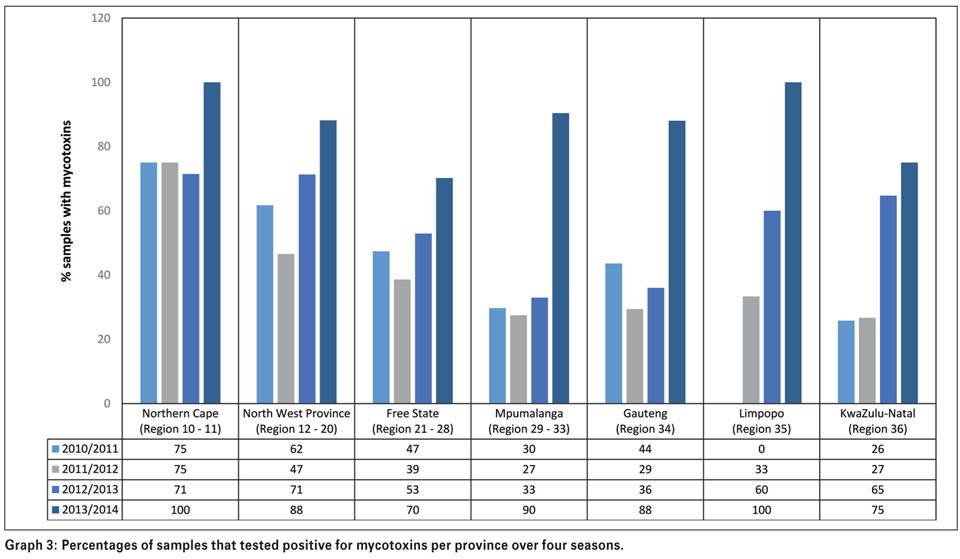
Mycotoxin results over seasons
The annual maize crop quality surveys provide an ideal opportunity to evaluate the occurrence status of mycotoxins throughout all production regions in South Africa. For the 2010/2011 season, a total number of 325 samples were analysed for mycotoxin residue levels. From the 2011/2012 to 2013/2014 seasons, 350 samples were analysed annually. The samples were selected to represent all the production regions as well as both white and yellow maize proportionally.
Locally
Locally, fumonisin and DON were found in samples from all the maize producing regions. Different patterns of occurrence are observed in different seasons. Mean concentration levels also differ over seasons. Fumonisin tends to show higher mean concentrations on yellow maize compared to white maize from the same region. DON shows higher mean concentrations on white maize than yellow maize from the same region. Zearalenone mean concentrations tend to show better correlation between white and yellow maize from the same region than fumonisins and DON.
Maize imported and exported during the 2013/2014 production season
A total of 79 673 tons of yellow maize was imported from the Ukraine during the 2013/2014 season (27 April 2013 to 25 April 2014). Five samples of imported maize were received at the SAGL for quality analysis purposes. One of the samples was graded YM2 and four of the samples YM3, according to South African grading regulations. The main grade determining factor was the percentage of defective kernels below the 6,35 mm sieve.
The percentage of stress cracks observed on the imported maize is significantly higher than that of local maize. Breakage susceptibility showed the same trend as can be expected. The imported maize kernels were on average smaller than locally produced maize. Protein results between imported and local maize compared well. South African maize of corresponding grades had lower fat and starch contents on average. The imported maize tested positive for fumonisin B1, deoxynivalenol and HT-2 toxin. None of these levels raised any concern.
During the season under review, 925 925 tons of white maize and 1 129 938 tons of yellow maize were exported to both Africa and overseas. The Maize Trust investment in the annual crop quality and imported maize quality surveys has created unique and extremely useful databases of quality measurements over several seasons, regions and countries of import.
The detailed results are available on the SAGL website (www.agl.co.za). The annual crop quality reports in PDF format are also available to download from the website.
With gratitude to the Maize Trust for financial support of these annual surveys and to the members of Agbiz Grain and DAFF inspectors for providing the crop and imported maize samples respectively.
Publication: August 2015
Section: Relevant


