


farm and production analytics, BFAP
 Ramonde Odendaal,
agricultural economist, Senwes
The Bureau for Food and Agricultural Policy (BFAP) is not new to benchmarking and the effective use thereof to measure farm-level competitiveness. BFAP is part of the international agri benchmark network, where various crop-producing countries compare information on important farm-level performance indicators, such as cost of production, input use efficiency and productivity as well as production system approaches and technologies.
This network consists of more than 40 countries with a coverage of 36 crops. Grain SA, in collaboration with BFAP, analyse these figures annually and identify focus areas that need improvement. Recently, in partnership with Senwes, BFAP applied the same methodology to expand the area coverage of prototype farms in the Free State with the objective to account for increased variation in this region. Grain SA, together with BFAP and other role players, are now also in a process of expanding this to other regions to obtain similar information.
Benchmarking is an effective tool to evaluate and compare information to improve farm-level competitiveness on an international and local level within the grain industry. This article highlights a few of the most important findings from the analysis.
Source: Agri benchmark, BFAP and Senwes, 2019
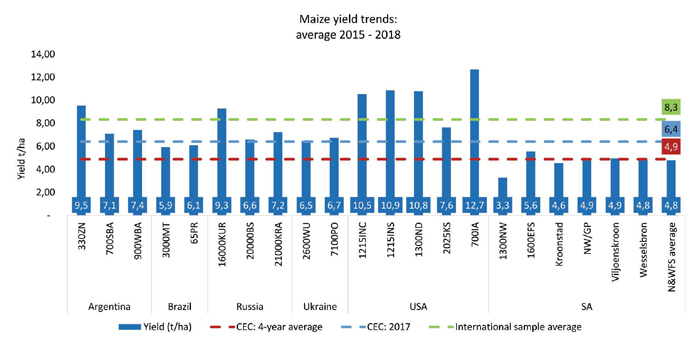
South Africa has a disadvantage if rainfall is compared against key international grain-producing countries. Based on the prototype farms used in the analysis, on average South Africa receives between 500 mm to 570 mm of precipitation per annum, substantially lower compared to the international sample average of 780 mm per annum and as high as 1 400 mm in the Mato Grosso region in Brazil. These climatic factors had a significant impact in terms of South Africa’s performance of maize yield in a global context. The international sample average is 8,3 t/ha, with areas such as Iowa and Indiana (USA) reporting yields as high as 12,7 t/ha and 10,9 t/ha respectively. The four-year average maize yield of the crop estimates committee (CEC) amounted to 4,9 t/ha, more than 40% lower compared to our international counterparts. It is clear that with our rainfall and the yields achieved, the competitiveness in South Africa is already under strain.
Source: Agri benchmark, BFAP and Senwes, 2019
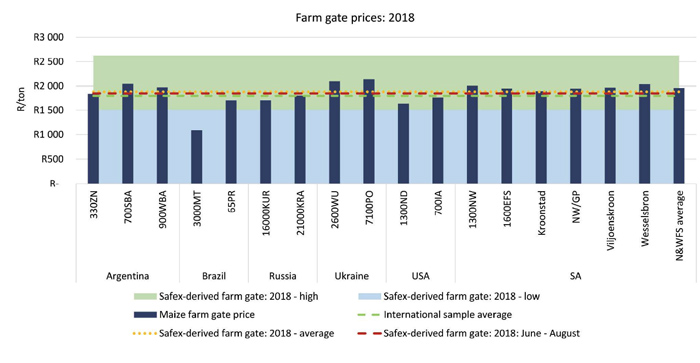
From a market and marketing perspective, the 2018 maize farm gate prices were compared within the countries. Based on these values, the South African farms used within the analysis were R166/ton above the international comparisons. To understand the competitiveness of local marketing, the average farm gate price from the prototype farms were compared to a Safex equivalent or derived farm gate price for different periods throughout 2018. The results indicate that these farms have received R82/ton above the 2018 average Safex-derived price and R115/ton more if compared to the period from June to August 2018.
Source: Agri benchmark, BFAP and Senwes, 2019
If the prices are compared to the highest and lowest Safex price movements, the farms within the model were R459/ton above the lowest price and R667/ton below the highest.
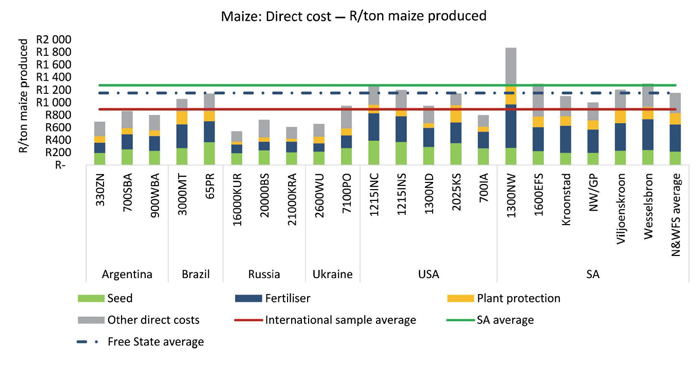
One of the factors which has a large impact on competitiveness is cost structure, especially if one accounts for yield and, therefore, the amount that a producer has spent to produce a ton of maize. The cost of production in this analysis is presented in a cost per ton maize produced. Within the international model the average direct allocable cost is R894 per ton maize produced. In South Africa, the cost is 43% higher at R1 277 per ton maize produced. The Northern and Western Free State average is marginally lower at R1 154 per ton, however, still 29% higher compared to our international counterparts. The cost of fertiliser is 80% higher, driven by a combination of lower yields and higher nutrient costs.
Source: Agri benchmark, BFAP and Senwes, 2019
In terms of costs on a per hectare basis, South Africa is 22% lower than the international scenario, indicating the large effect of yield on costing structures and margins. If one compares the direct costs as a percentage of gross production value (GPV), South Africa is the same as the international sample on 52%. However, South Africa has a challenge when overhead costs are compared to international maize producers. If overhead costs are expressed as a percentage of total costs, South Africa amounts to 21% where the international sample ranged between 8% to 39%, with an average of 16% across countries.
Source: Agri benchmark, BFAP and Senwes, 2019
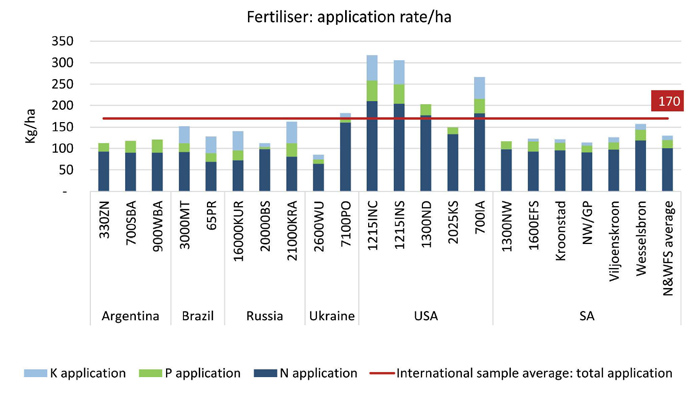
The value of the methodological approach is that apart from financial data, it also captures technical data on input use and production systems and integrate them into efficiency indicators such as fertiliser productivity. Fertiliser is often the single most expensive input variable, contributing the largest share in direct costs on many South African dryland farms. It is therefore important to assess and measure the use of fertiliser in the context of productivity indicators. The analysis showed that on average, South Africa’s nitrogen (N), phosphorus (P) and potassium (K) application are less compared to the international sample. South Africa uses 99 kg/ha N, 20 kg/ha P and 9 kg/ha K compared to the international sample of 121 kg/ha N, 25 kg/ha P and between 11 kg/ha and 59 kg/ha K. Although fertiliser application is less, the productivity of fertiliser use is also lower compared to the international counterparts. A nitrogen productivity indicator was developed which measures the kilograms of maize that were harvested for every kilogram of N applied. The international average was 76 kg of maize per 1 kg of N applied, whereas South Africa only harvested 48 kg of maize.
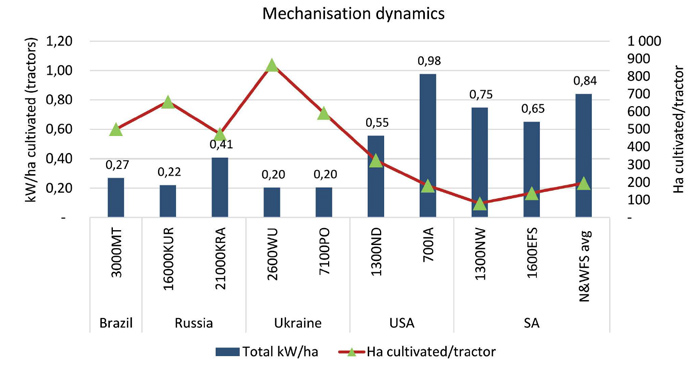
 In terms of mechanisation use, comparisons were made on a kilowatt per hectare cultivated and amount of hectares per tractor to measure aspects of capital investments. South Africa (0,7 kW/ha) compares well with the USA producers (0,8 kW/ha), but is substantially higher than countries such as Brazil, Russia and the Ukraine (0,26 kW/ha). However, hectare cultivated per tractor in South Africa is lower compared to the international counterparts, especially when compared to Brazilian, Russian and Ukrainian farms, which ranged between 500 ha to 700 ha cultivated per tractor. South Africa would differ between 81 ha and 300 ha. However, this is highly variable and depended on the type of cultivation – no-till producers can be as high as 400 ha.
The comparisons in this analysis show the value in measuring farm-level data in the context of competitiveness, not only internationally, but also locally. Although aspects such as agro-ecological potential and climatic conditions are beyond the control of the producer, the approach towards production systems and input use can be assessed to determine the relative competitiveness of South African producers who compete in a global market space. The analysis assists in identifying potential shortfalls that affect primary grain production, but also creates the opportunity to critically evaluate the status quo and to identify interventions that allow the sector to grow in a competitive and sustainable manner. These interventions should address yield gaps in a cost-competitive way, which can be achieved through improving efficiency levels and to utilise resources optimally to achieve maximum profits. The new Data Intensive Farm Management (DIFM) consortium is already doing research on seed density and nitrogen application in order to achieve this.
It is important that as much as possible producers participate in these benchmarking exercises – the more data available, the better the decision-making. These exercises also assist producers on an individual basis to compare and to improve.


