


Karen Truter, BFAP; Stellenbosch University

Dr Dirk Strydom,
head: Marketing,
NAMPO and Research Coordination, Grain SA
The Data Intensive Farm Management (DIFM) project is a multi-disciplinary research project that is funded by the United States Department of Agriculture’s, National Institute of Food and Agriculture (USDA-NIFA) food security programme grant. It is managed by the University of Illinois, in collaboration with Louisiana State University, University of Massachusetts-Amherst, Montana State University, University of Nebraska, Texas A&M University and Washington State University.
In 2019, the University of Illinois approached the Bureau for Food and Agricultural Policy (BFAP) in the hope of applying the DIFM methodology in South Africa. A local research consortium was formed including the Sasol Trust, the Protein Research Foundation, Grain SA, the Agricultural Research Council and the Stellenbosch University.
Since 2019, the programme has assisted five producers in planting and processing data from 21 maize trials and 14 soybean trials throughout the northern production regions. More recently, since 2023, two producers in the Western Cape with wheat and canola trials were added to the collaboration.
DIFM trials rely on the producers’ precision planting equipment (the ability to vary seed and fertiliser with planting) and aim to deliver a methodology for performing seed and fertiliser rate trials on large scale. Trials practically result in a ‘checkerboard’ or gridded design of randomised seed and fertiliser applications covering whole fields. The system that is being developed by the DIFM-US project will also provide the ability to apply data-processing algorithms (including machine learning and clustering techniques) to yield large, clean datasets containing combinations of yield, seeding and fertiliser rates for further statistical and economic analysis.
The tools developed by the project can be accessed here by scanning the QR code. Results from a soybean field in Mpumalanga and a maize field in North West are presented in this article.
Results from the 2023 trials
Soybeans, Mpumalanga
D3 is a 50 ha-field in Wonderfontein, Mpumalanga, that has been used for soybean and maize DIFM trials since 2019/2020. In the 2022/2023 season, soybeans were planted in the gridded trial design with the focus on soybean seeding rates. The producer usually plants an average of 280 000 plants/ha and the trial varied seeding rates between 200 000 and 400 000 plants/ha.
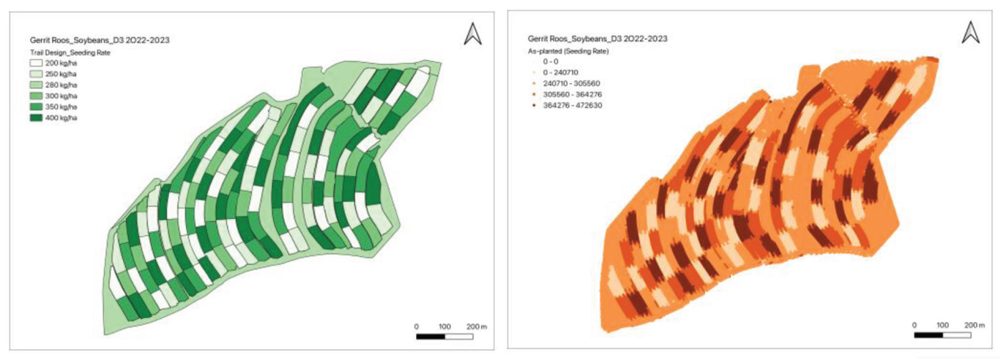
The producer plants soybeans with a John Deere 1755 SeedStar 2,8-row planter (76 cm row width), with a Greenstar controller. The trial design (see left-hand side in Figure 1) was provided to the producer and the trial was accurately planted on 19 November 2022 according to as-planted data (see the right-hand side in Figure 1).
This trial was harvested on 18 April 2023 with an overall average yield of 2,16 t/ha (see the left-hand side of Figure 2).
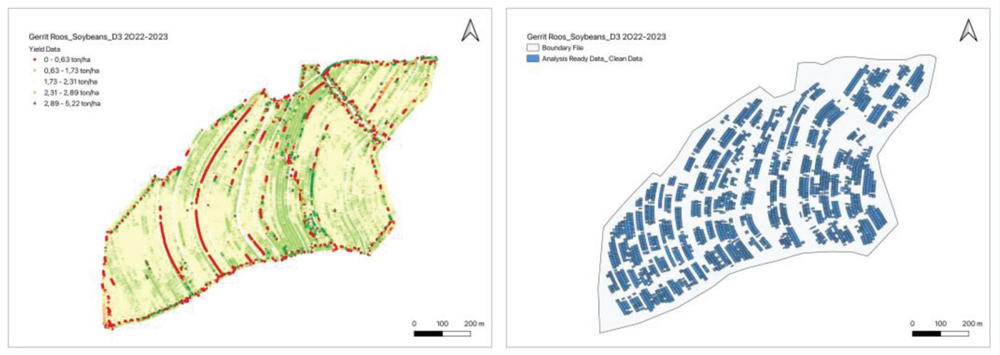
Due to the contour changes throughout the field, the trial grid was designed in four planter-widths, to allow more accurate planting and harvesting and therefore maximising the amount of clean data points. Clean data points can only be compiled from data with sufficient overlaps between the harvest data, applied seed and fertiliser rates. Data that do not overlap as originally accounted for in the trial plan, will be removed from the clean data. The right-hand side of Figure 2 depicts the cleaned subplots with 3 779 observations of consistent yield (harvest data) and plant population (as-planted data) data points. Machine learning and clustering algorithms were utilised in generating the cleaned data set, which is used for further analysis.
The profit calculation presented in Figure 3 assumes an average soybean price of R8 600/ton and an average soybean seed price of R12 125/ton (or 0,55 c/seed). Note that only the direct cost of seed was taken into account in this ‘profit’ calculation and that other direct and indirect expenses were not taken into account.
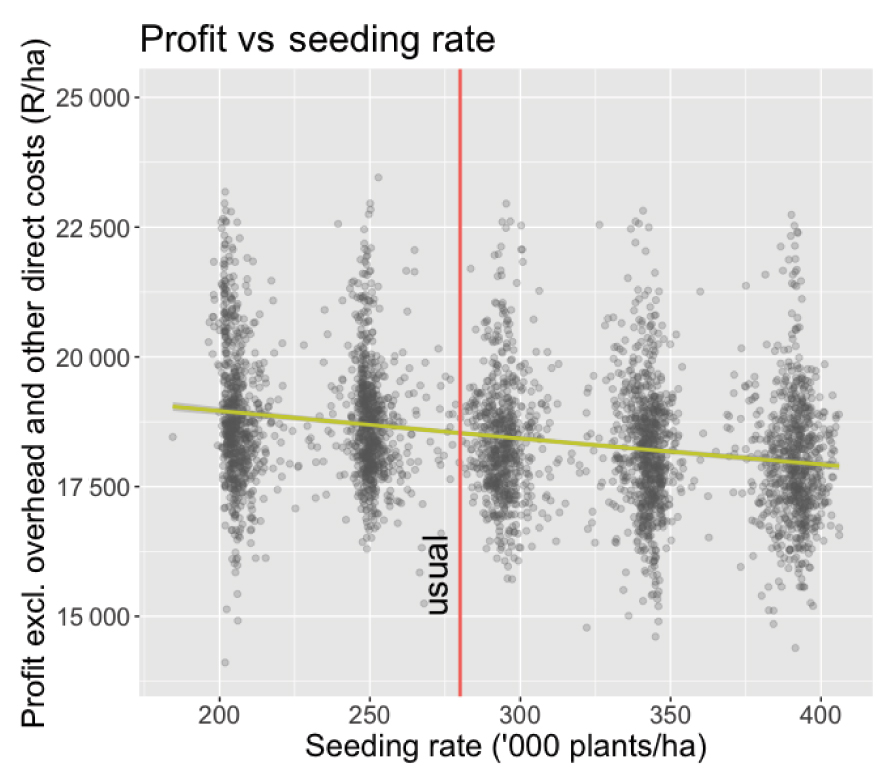
Figure 3 implies that if the producer decreased his seeding rate to 200 000, he could increase his profit by R434/ha based on a 0,03 t/ha increase in estimated yield, in a season with similar climatic and environmental factors to the 2022/2023 season. However, the producer cautioned against reducing the seeding rate too much because of the risk related to emergence.
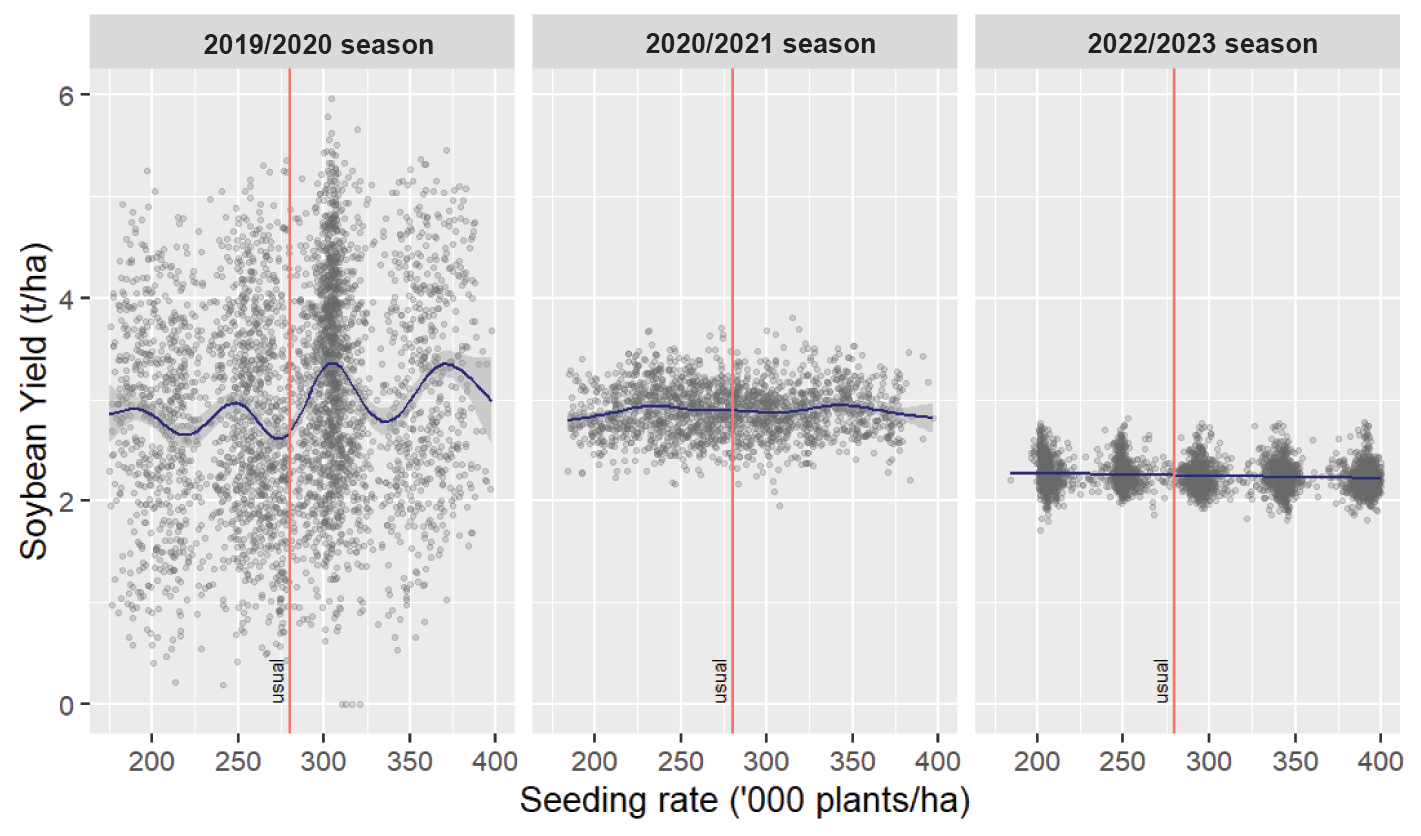
The same trial design was repeated on the D3 field in three seasons over the past four years. The yields from 2020, 2021 and 2023 are plotted against the seeding rate treatments in Figure 4. The red vertical lines represent the producers’ usual average seeding rate of 280 000 plants/ha. The ‘yield response curve’ to soybean seeding rate is not sloped significantly over the three seasons. 2020, which was a wetter than average season, showed a slight increasing trend, implying that yield could be maximised at a slightly higher seeding rate (300 000 to 375 000 plants/ha, 0,5 t/ha yield increase), while 2023, a drier than average season, showed a slight decreasing trend, implying that yield could be optimised with a lower seeding rate (200 000 plants/ha, 0,03 t/ha yield increase).
Maize, North West
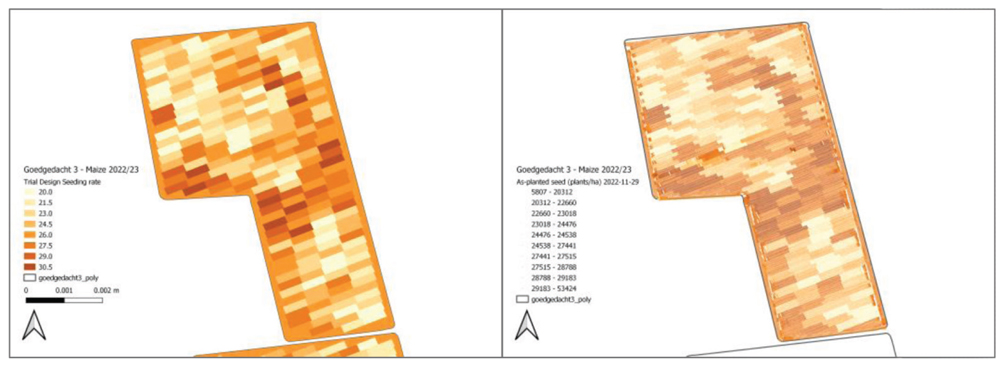
Goedgedacht 3 is a 36 ha-field in the Ottosdal area of the North West Province, where maize has been planted for the DIFM trial since the 2020/2021 season. However, the producer has been employing variable seeding and fertiliser rate applications on his farm for several years. The average planting practices are as follows: 25 000 plants/ha, 155 kg/ha MAP fertiliser and 190 kg/ha NPK (2:0:1) fertiliser. The producer also broadcast an average of 230 kg/ha 1:0:0(40) KynoPlus fertiliser on all his maize fields prior to planting. The producer has a 12 row (3 feet row width) planter that is 10,95 m wide, and the trial grid was designed to be 2 x 10,95 m wide.
Figure 6 presents the seeding rate trial design (left-hand side) which was provided to the producer and was planted on 29 November 2022 (as-planted data on the right-hand side of Figure 6). The trial was planted fairly accurate, with minor displacements in transition zones (when moving from one treatment block/grid to the next).
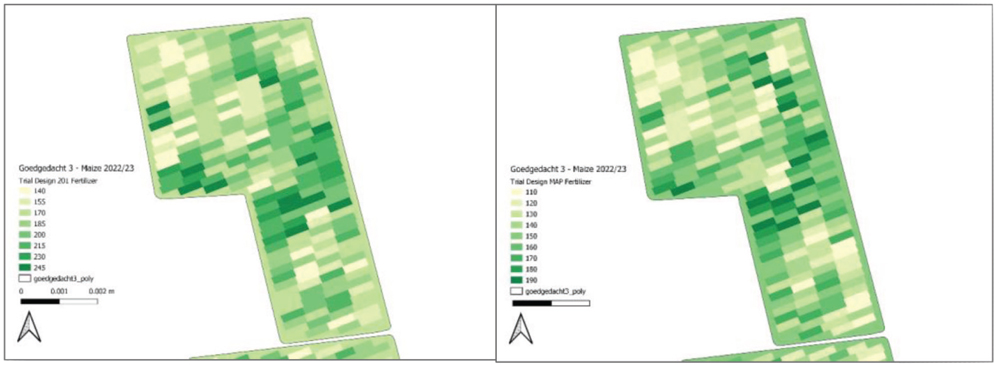
Due to complications with the planter and fertiliser application technology, the as-applied fertiliser data could not be retrieved, and the trial design values (see Figure 5) were used for data cleaning and further analyses.
The trial was harvested on 4 July 2023 with an overall average yield of 9,2 t/ha. The harvest data (see left-hand side of Figure 7) were combined with the as-planted seeding rate data as well as the trial design values for fertiliser applications in order to generate 934 subplots of coherent yield, seeding and fertiliser rates (Figure 7, right-hand side).
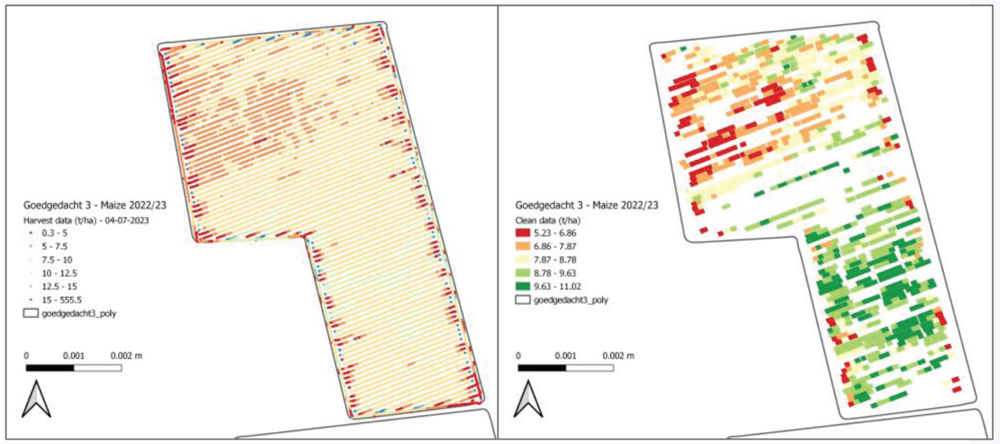
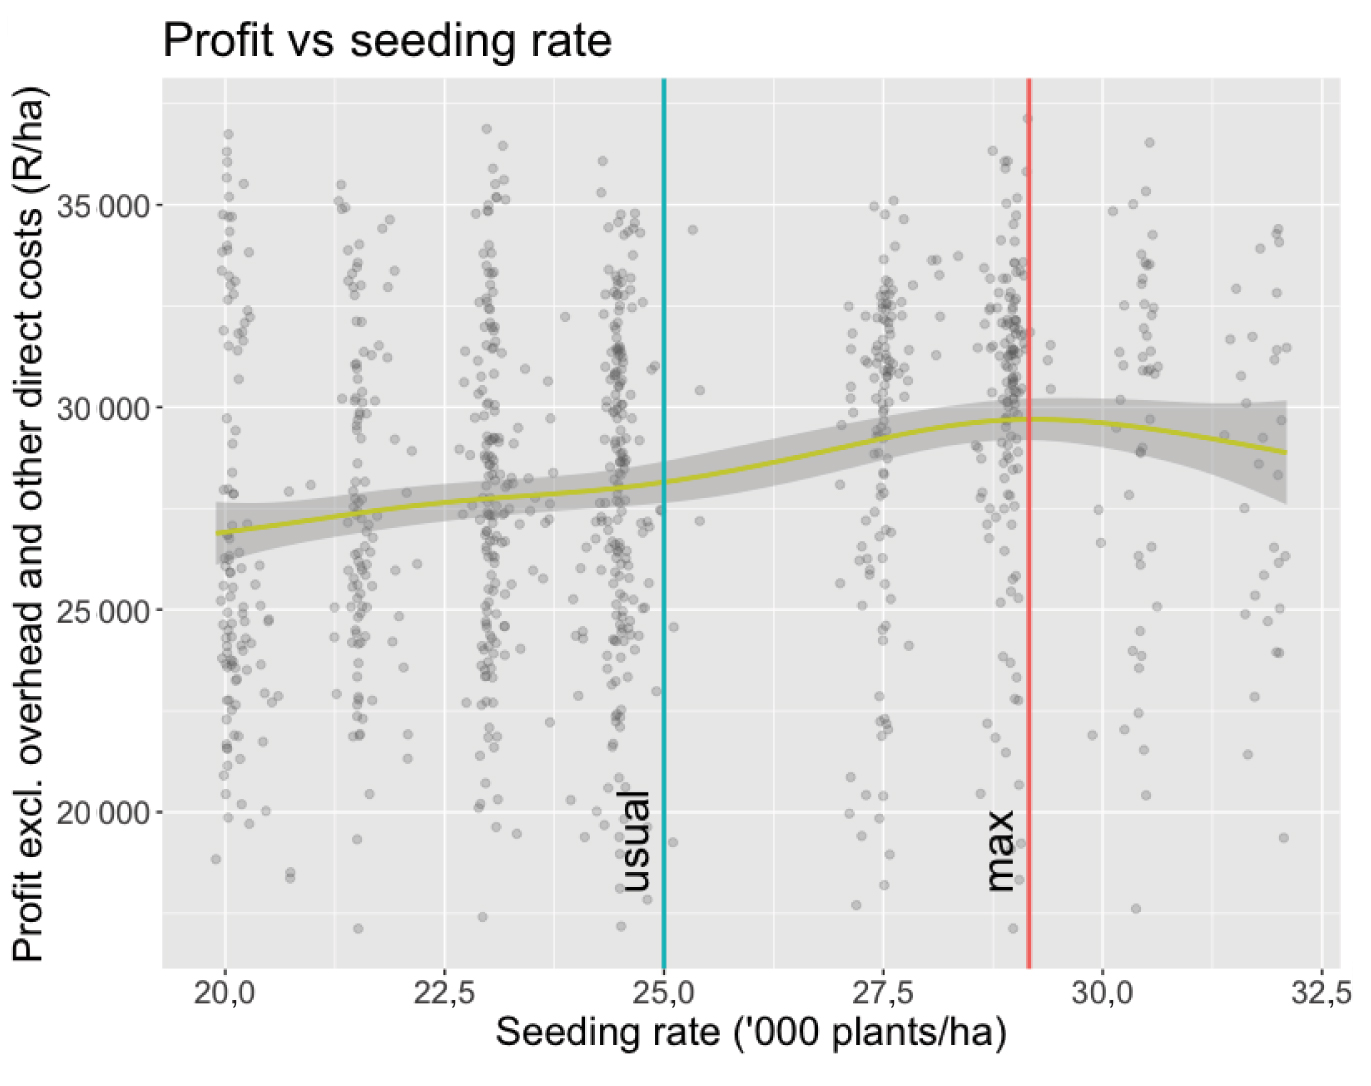
Figure 8 shows the gross profit calculation (only taking the seed cost into account and excluding all other direct and indirect expenses) per seeding rate applied for the field. The blue line indicates the producer’s chosen average seeding rate of 25 000 plants/ha while the red line indicates the profit maximising flat rate of 28 850 plants/ha. If the producer were to plant this higher seeding rate on Goedgedacht 3 in a season comparable to 2022/2023, the resulting yield gain is calculated at 0,48 t/ha and the producer could as a result pocket R1 532/ha more.
Similarly, the trial results indicated that profits could be increased in a season comparable to 2022/2023 with higher fertiliser rates (MAP at 185 kg/ha and NPK (2:0:1) at 214 kg/ha).
Since the producer has been managing this field with variable fertiliser application, the trials were designed with in-field yield potential differences in mind (i.e., pre-determined management zones based on yield potential). Figure 9 shows the maize yield achieved per seeding rate applied for low, medium, and high yield potential zones in the field. In 2021/2022 (left-hand side, Figure 9) response curves did not differ significantly across zones, with general increasing yield returns as seeding rates increased. On the other hand, response curves differed substantially in the 2022/2023 results (right-hand side, Figure 9). The low and medium potential zones showed slightly decreasing yield outcomes for higher seeding rates, while the high potential zone showed a clear yield maximising turning point at 28 850 plants/ha.
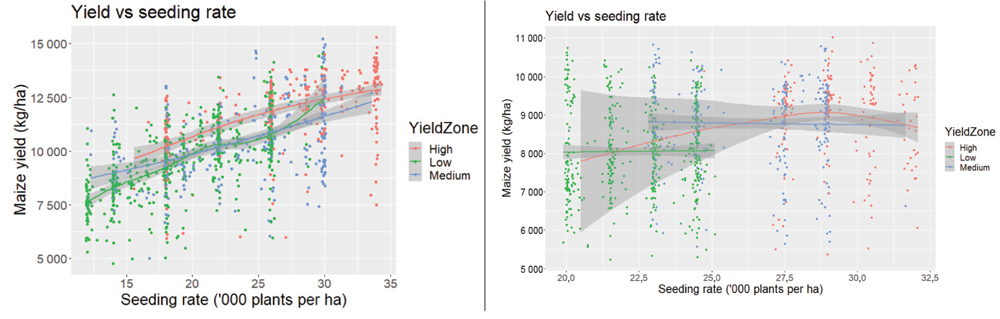
The producers’ insights into these significant differences relate mainly to the seasonal differences in the amount and timing of rainfall. The 2022/2023 season had a typical mid-summer drought which was not the case in the 2021/2022 season that had significantly higher and well-timed rainfall. Another factor that could have contributed to the decreasing yield outcome on highly seeded high potential zones is over-fertilisation of the highest potential zones due to the large amount of chemical fertiliser applied on the given zones.
Valuable insights
The results discussed, of both the soybean field in Mpumalanga and the maize field in North West, delivered some valuable insights to the producers and their learnings regarding operational practices. However, the results also present some significant differences in subsequent seasons and demonstrate that the recommendations from these trials remain farm-specific (and even field-specific) as well as season-specific.
Even though the DIFM methodology is not generalisable over regional production areas, it could potentially allow producers to perform large-scale on-farm experiments on their own farms to calibrate their seed and fertiliser ‘usual’ rates for agronomic and economic optimums. The trial designs and data processing contribute to faster learnings on each farm where they were applied while highlighting the importance of taking spatial and temporal variation into account when planning input management strategies.


