


The continued war in Ukraine has significantly reduced the ready supply of energy. This of course is reflected in increased prices of commodities dependent on the use of energy for the manufacture and shipment thereof. Fertiliser, in particular nitrogenous fertiliser, is a prime example.
The extraordinary increase in the price of nitrogen (N) as input in grain production places increased scrutiny on its efficient use. Over and above, there is amplified pressure on producers to become carbon neutral, with the fact of carbon tax looming. Inefficient use of N contributes significantly to an increased carbon footprint and pollution of the environment. In fact, an estimated 35% of applied N is utilised by crops in the world, meaning 75 million tons of N run off into rivers, lakes, and natural environments (Richie, 2021).
All of the above mentioned are taken into consideration by grain producers who strive for responsible, sustainable production.
Nonetheless, how will economically optimised application of N, with a relative high price to the value of grain, influence yield levels, margin, and nitrogen use efficiency (NUE)?
Current guidelines were developed with relatively low price ratios
Price ratio in the context of this article is the cost of N per kilogram, divided by the value of the grain sold, also per kilogram.
Most work to develop fertiliser guidelines for maize and wheat was done from 1970 to 2000 by the Fertilizer Society of South Africa (now FERTASA), the Agricultural Research Council (ARC) and certain fertiliser companies. Guidelines, especially for N, were primarily developed by establishing site-specific production functions. The economic optimum N application was calculated from said functions using a specific price ratio.
During the mentioned period, price ratios were stable and quite low. The economic optimum was also often derived – especially at later stages – at 95% of relative yield over several seasons per site. In both cases the derived or assumed economic optimum application would be close to the point of maximum yield, thus reflecting relative high N application rates.
To use maize as example; 1 kg of N could be exchanged for approximately 4 kg of maize grain during the early 1990s. It gradually increased during the early 2000s to a maximum of about nine during the economic crisis of 2008 and then stabilised on approximately six thereafter. The price ratio reached a peak of twelve during the third quarter last year due to soaring fertiliser prices. Over recent months the ratio seemingly again stabilised on six.
Illustration of the effect of a high price ratio on recommendation rate, margin and NUE
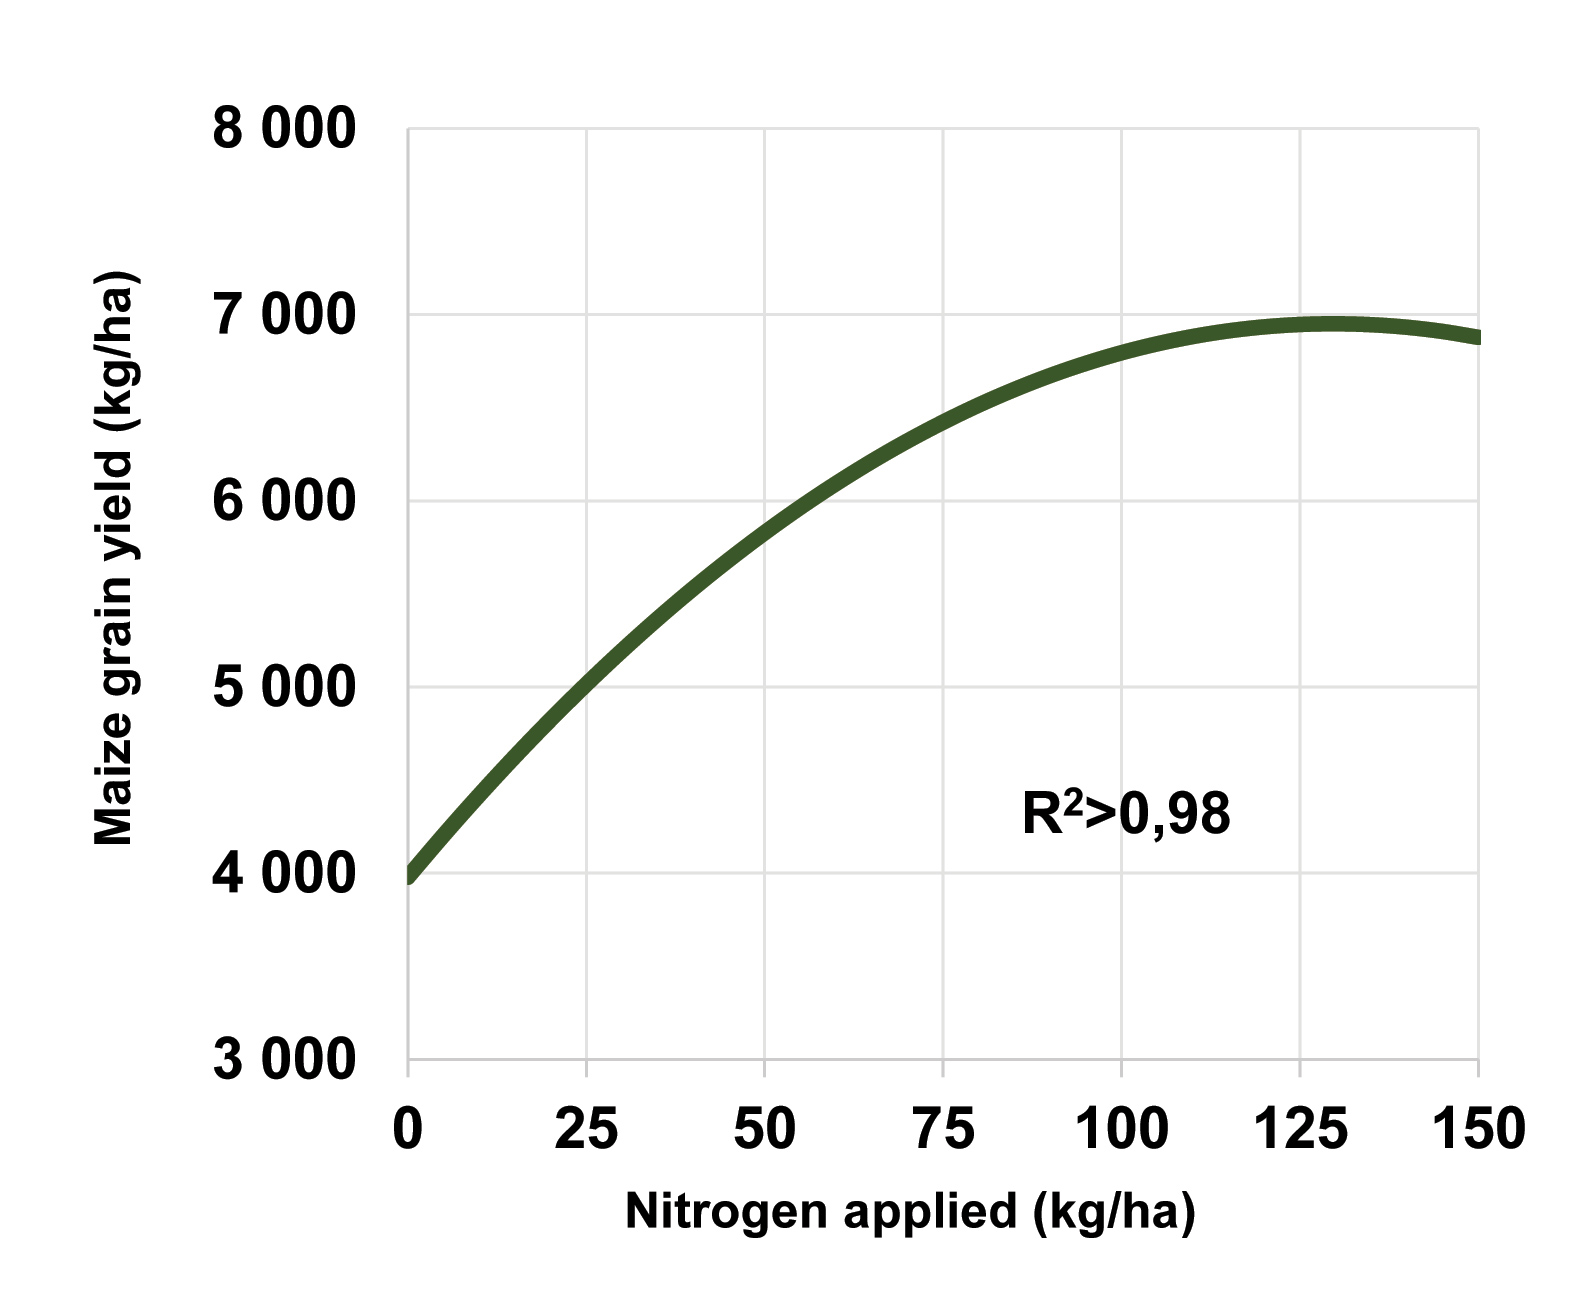
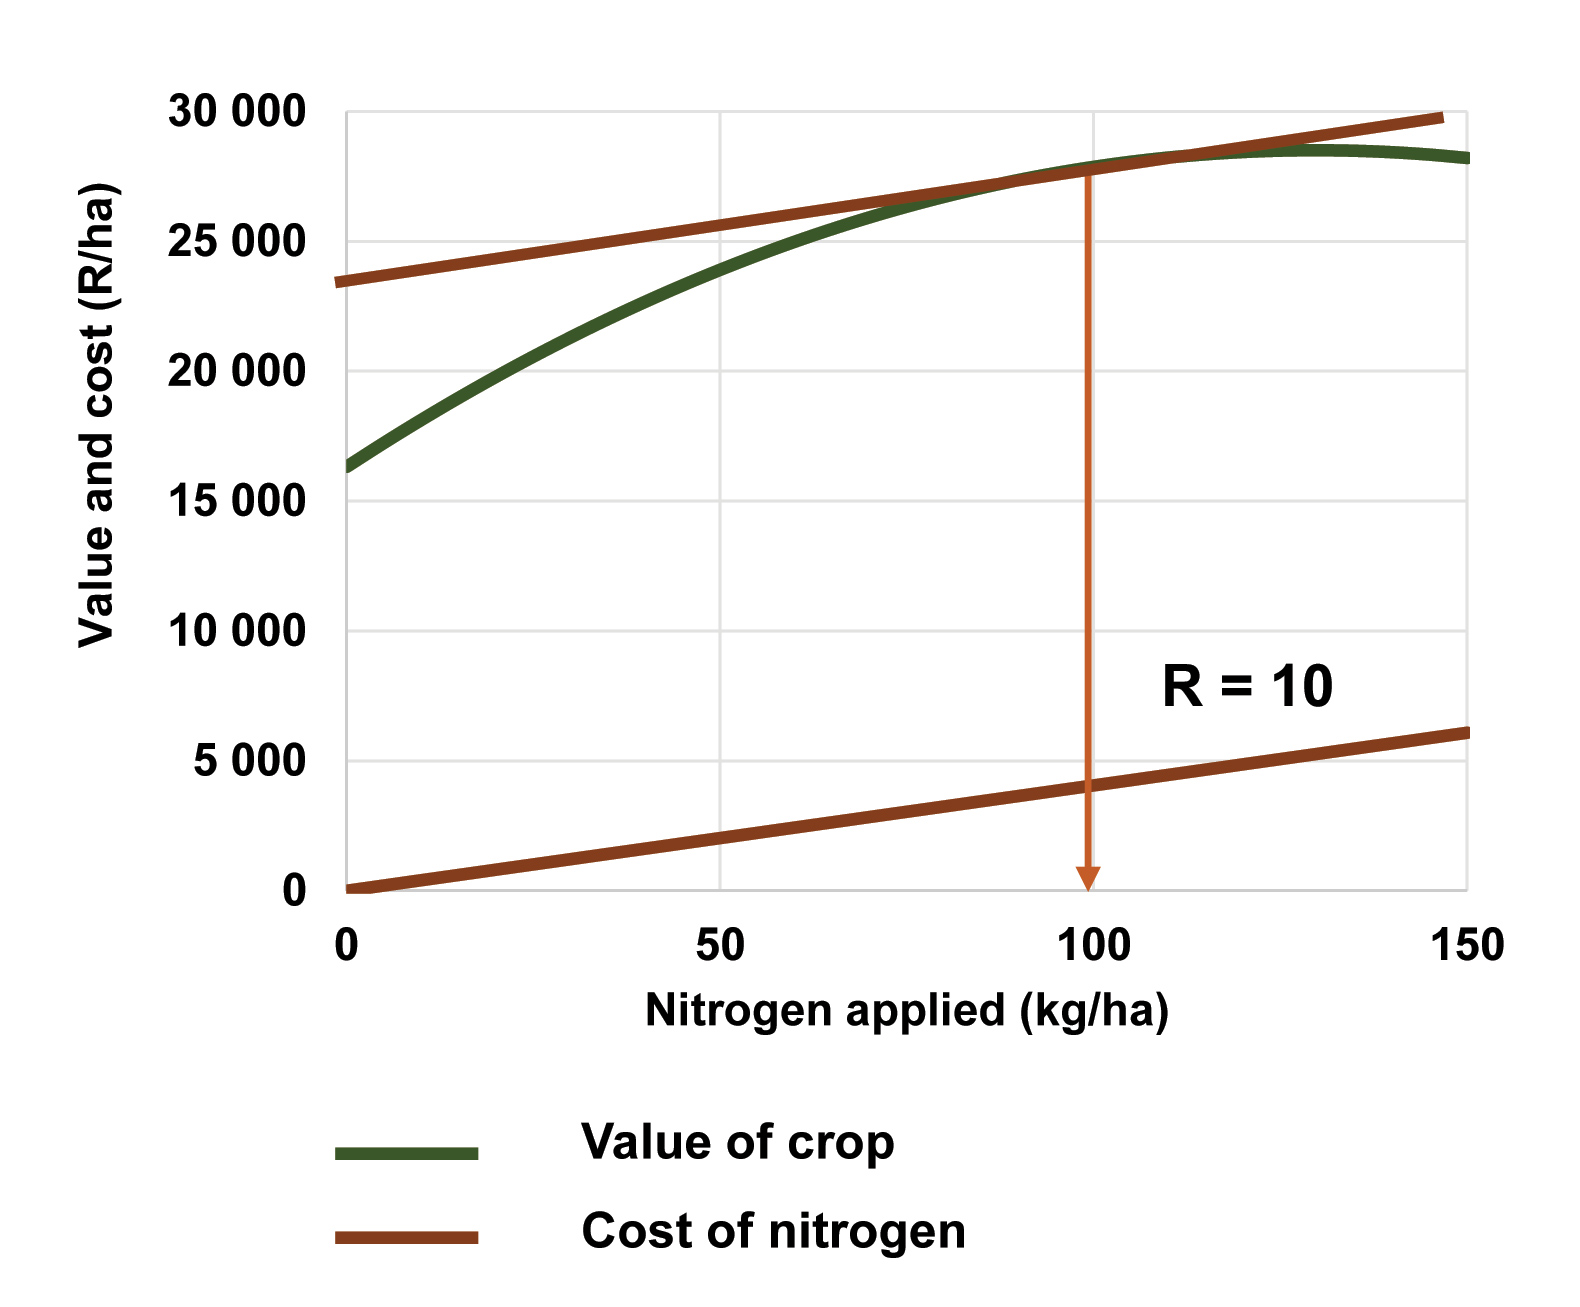
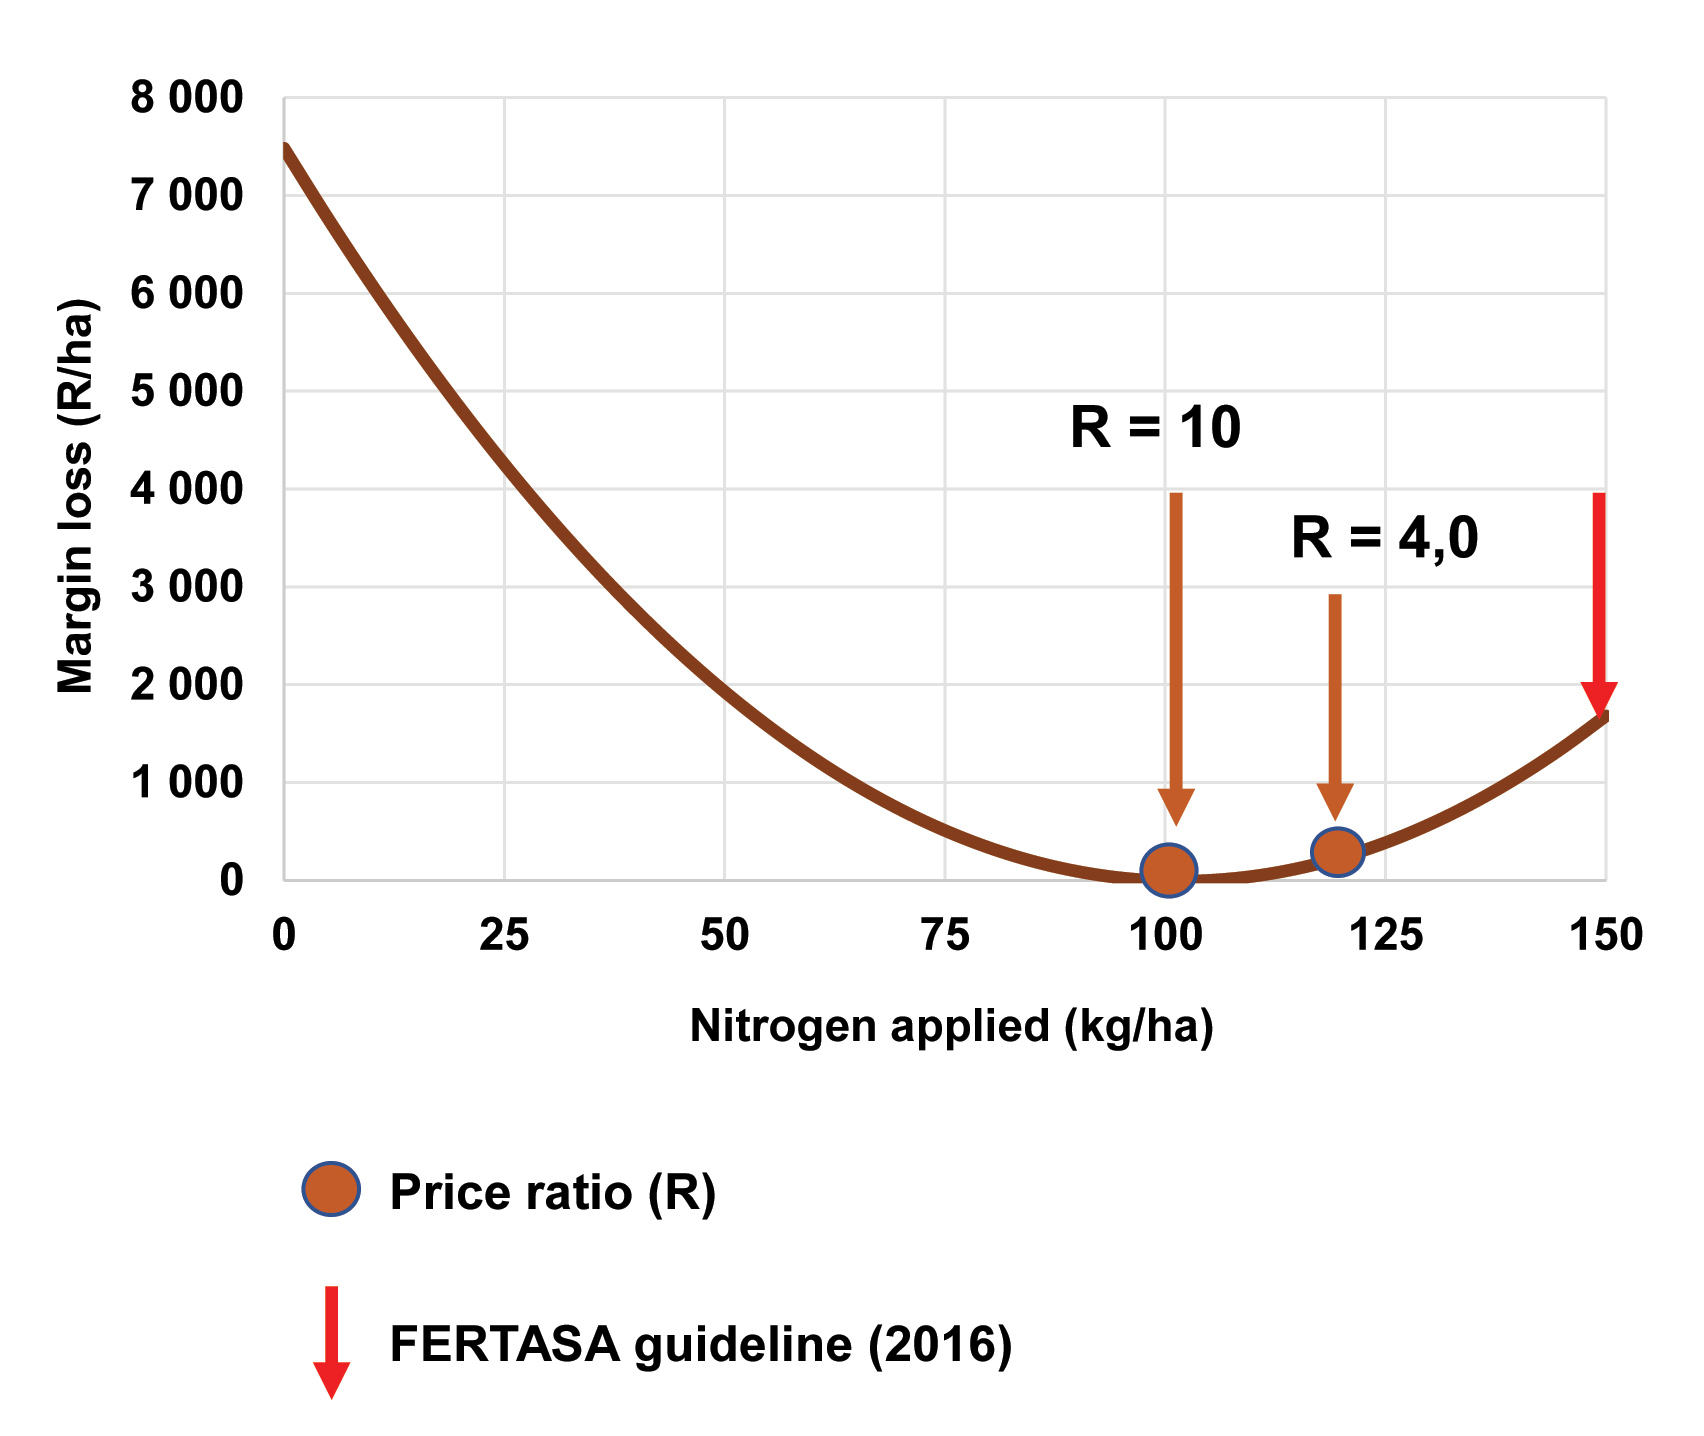
As example, using the price ratio of ten (from fertiliser price lists for urea in July 2022 and the Safex maize price for 2023) it was established from historic production functions (AECI agronomic research data) on a medium-textured soil (24% clay) on the eastern Highveld (Nigel) with a long-term median yield of 7 t/ha (Graph 1 and Graph 2), that substantially less N should have been applied last year than the current guideline (FERTASA Fertiliser Handbook, 2016). It was also calculated that the decision would have been highly profitable with an increase in margin of over R1 500/ha (Graph 4).
It is a mathematical fact that NUE is at its lowest near maximum production and increases as N rates are reduced (Dowling, 2014). Using the popular partial nutrient balance as basis to evaluate NUE (kg grain N removed/ha per kg N applied/ha expressed as percentage) and the current FERTASA guideline for N application for a 7 t/ha yield, the value comes to an acceptable 70% (Fixen, 2014). However, with the economic optimum application rate at a price ratio of ten, the NUE increases with an additional 20%.
Minimum yield loss at economic optimum applications
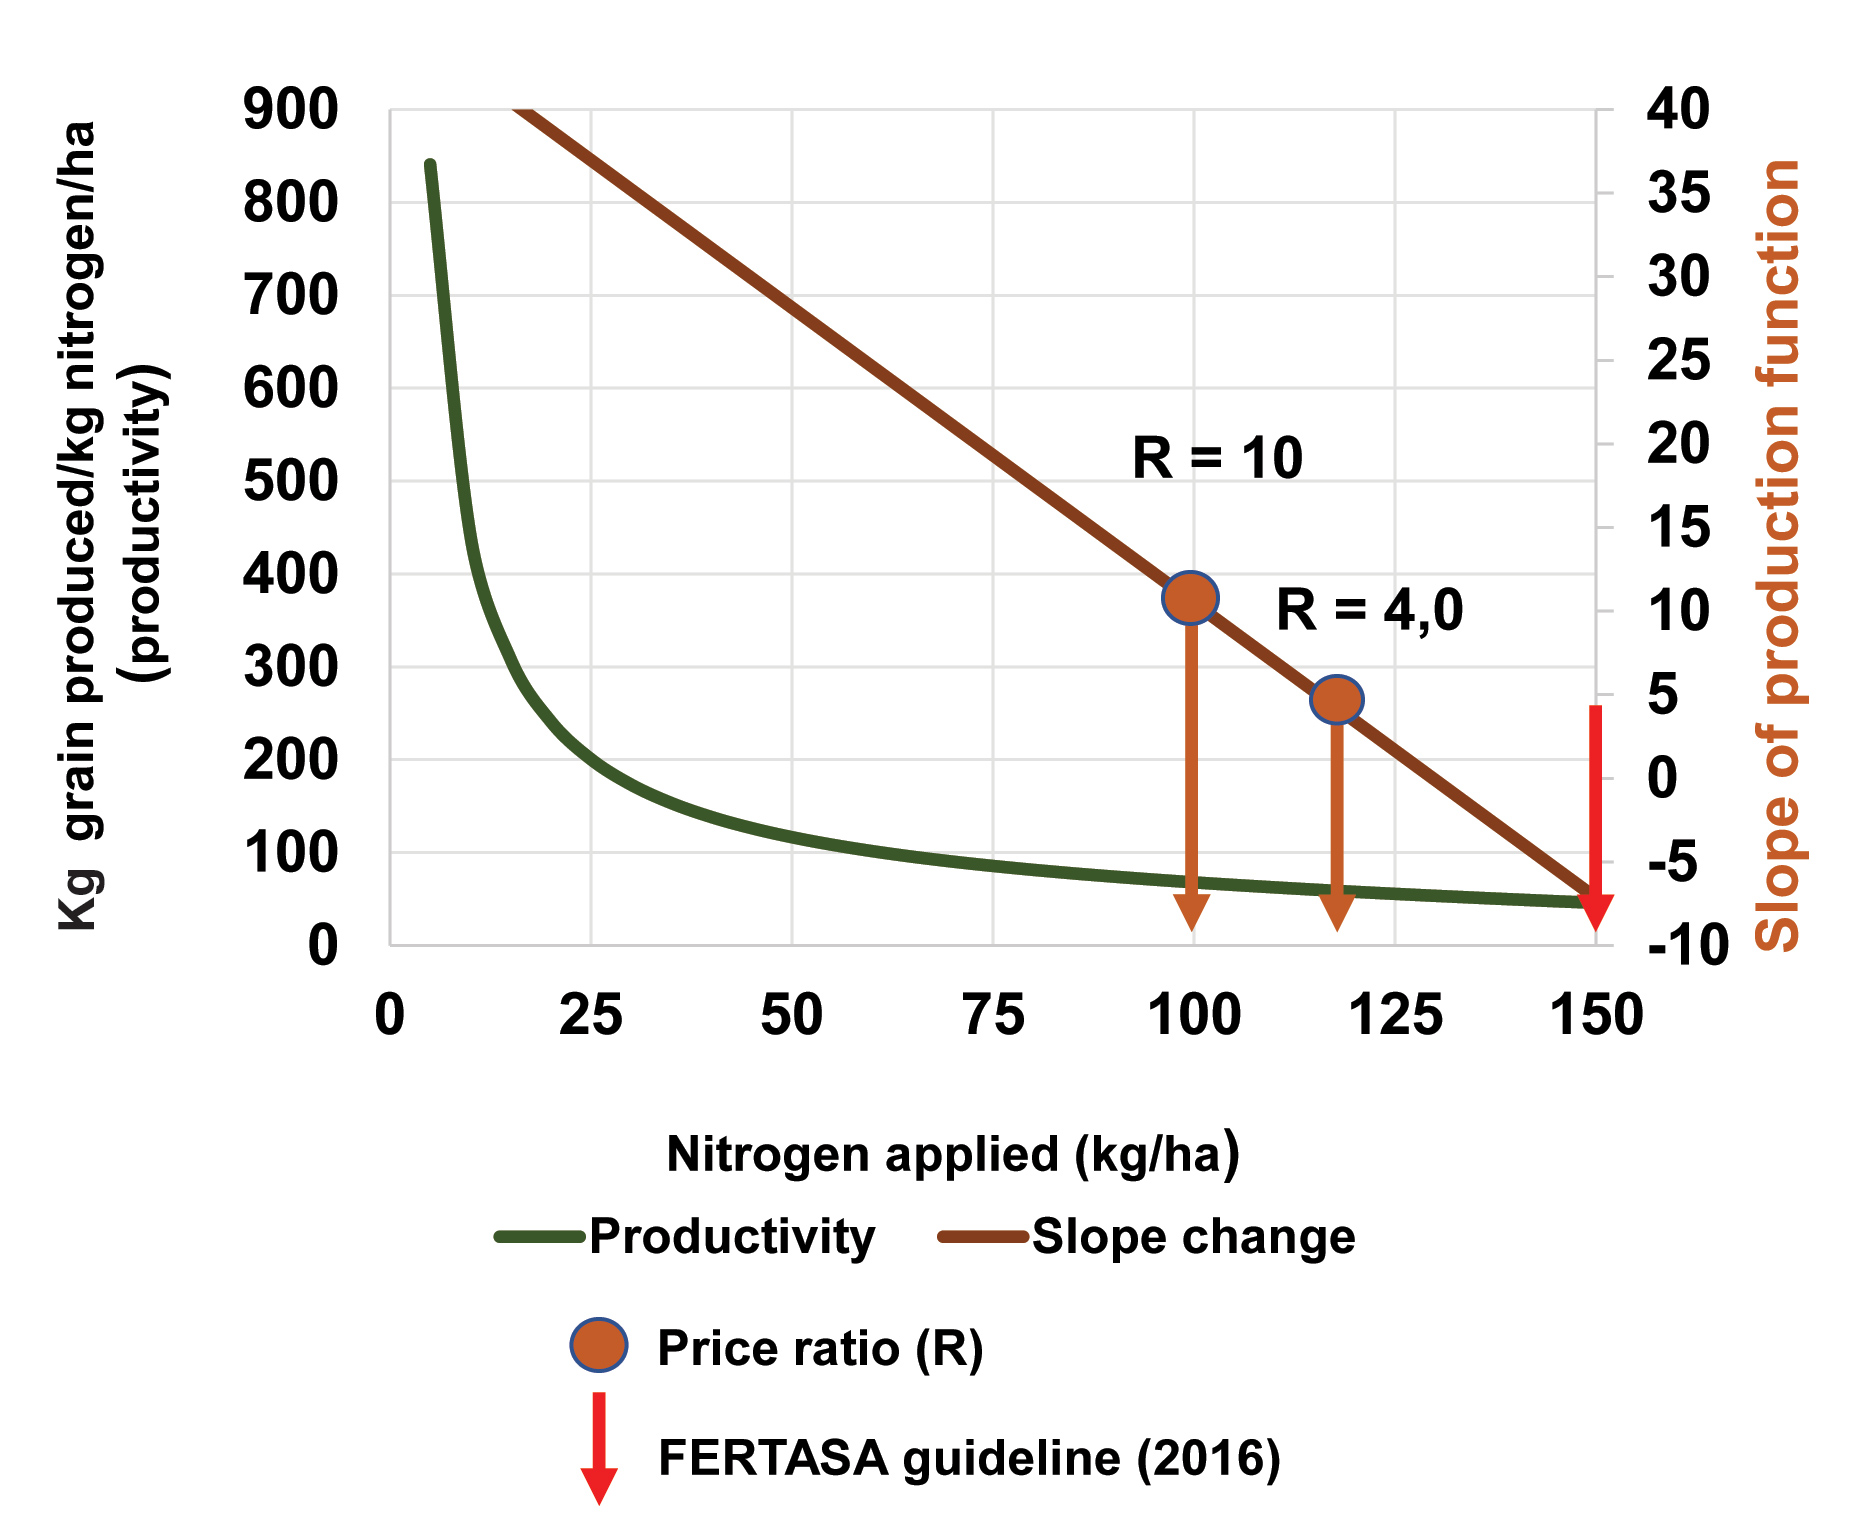
The law of diminishing returns dictates that productivity will reduce significantly near the peak of production. The response of grain to N input is no different. The response of grain production to N is usually in a quadratic form (Graph 1). Most importantly, near the range of economic optimum applications the productivity difference is low. In the example the difference between 100 kg and 120 kg N applied is only 10 kg grain per kilogram N applied (Graph 3).
What this means is that when the price ratio is high and application rates need to be reduced accordingly, the risk of yield loss is minimal and the saving of N substantial. In the example used, reducing N application from 120 kg/ha at a price ratio of four to 100 kg/ha at a price ratio of ten implies a saving of R800/ha regarding N cost and a risk of loss of yield of 140 kg/ha. However, comparing it to the current guideline, it would mean a saving of R2 000/ha in N cost and a yield loss of less than 100 kg/ha.
Using another calculation of NUE, called the partial factor productivity (kilogram grain produced/ha per kilogram N applied/ha), the NUE would increase from 57 kg grain per kilogram N at a price ratio of four to 68 kg grain per kilogram N at a ratio of ten, higher than currently achieved in North American and Western European (Fixen, 2014). The current guidelines would again reflect an acceptable NUE of 47 kg grain per kilogram of N.
NUE and economic optimised applications
Reliable site-specific production functions developed on farm, are invaluable for the efficient and economic management of N, especially if price ratios are as variable as in recent times. The example used above, is illustrative but factual. However, each case should be evaluated with available dependable data and taking the risk aversiveness of the producer into account. Unfortunately, not much effort has gone into generating recent fertiliser production functions, which leaves a large void with regard to formulating economically sound fertiliser recommendations, incorporating risk quantification (Bornman, 2022).
N and NUE have many definitions and related calculations. NUE values per se can be misleading if the context is not understood (Fixen, 2014). ‘The objective is to increase performance of cropping systems by providing economically optimum nourishment to the crop while minimising nutrient losses from the field. NUE addresses some but not all aspects of that performance’ (Mikkelsen et al., 2012).
Many management tools and systems may address the enhancement of NUE besides basic economic optimised application rates. These may include sophisticated soil analyses, use of handheld sensors, satellite remote sensing, precision farming, crop rotation, placement practices, crop stage-specific application, controlled release fertilisers, enhancement of soil and root health and management of nutrient interaction, to name a few (Bornman, 2022). It seems cultivar improvement, especially in the case of maize, has made the most significant impact on the improvement of NUE over recent years (Zhang et al., 2015). In any case, the return on investment and its probability should be considered carefully before implementation of a variable in nutrient management.
In summary
When the price of N is high relative to the grain crop price, N application rates should be optimised using site-specific production functions and the relevant price ratio. The result will be beneficial with regard to profitability and NUE. Using this approach, the risk of significant yield loss is low, but the savings in N cost may be substantial.
References:
- Bornman, JJ. 2022. Fertilization principles for grain production. FERTASA post symposium workshop. CSIR, Pretoria.
https://www.fertasa.co.za/wp-content/uploads/2022/10/Fertasa-workshop-presentation-Principles-Fertilization-JJ-Bornman.pdf - Dowling, C. 2014. The fundamentals of increasing nitrogen use efficiency (NUE). Web accessed January 2023.
https://grdc.com.au/resources-and-publications/grdc-update-papers/tab-content/grdc-update-papers/2014/02/the-fundamentals-of-increasing-nitrogen-use-efficiency-nue - Fixen, P et al. 2014. Chapter 1. Nutrient/fertilizer use efficiency: measurement, current situation and trends. In Managing Water and Fertilizer for Sustainable Agricultural Intensification by IFA, Paris, France.
https://www.fertilizer.org/images/Library_Downloads/2014_fue_chapter_1.pdf - Mikkelsen et al. 2012. Chapter 9. Nutrient Management Planning and Accountability. In 4R Plant Nutrition: A Manual for Improving the Management of Plant Nutrition (Bruulsema, TW, Fixen, PE, Sulewski, GD (Eds.), International Plant Nutrition Institute, Norcross, GA, USA.
- Richie, H. 2021. Nearly two thirds of applied nitrogen is not used by crops.
https://ourworldindata.org/excess-fertilizer - Zhang, X et al. 2015. Managing nitrogen for sustainable development. Nature 528, 51–59.
https://doi.org/10.1038/nature15743


