


Corné Louw,
senior economist,
Grain SA

Dr André Nel,
independent agronomist

William Deale,
independent agronomist
A memorandum of understanding for the funding and management of the 2019 fertiliser and lime quality monitoring project was entered into by and between the Department of Agriculture, Forestry and Fisheries (now Department of Agriculture, Land Reform and Rural Development), Fertasa (Fertilizer Association of Southern Africa), Grain SA and the Sasol Agricultural Trust.
The aim of this project was to establish whether liming material and fertiliser quality are maintained according to the regulations of the Fertilizers, Farm Feeds, Agricultural Remedies and Stock Remedies Act (Act No. 36 of 1947).
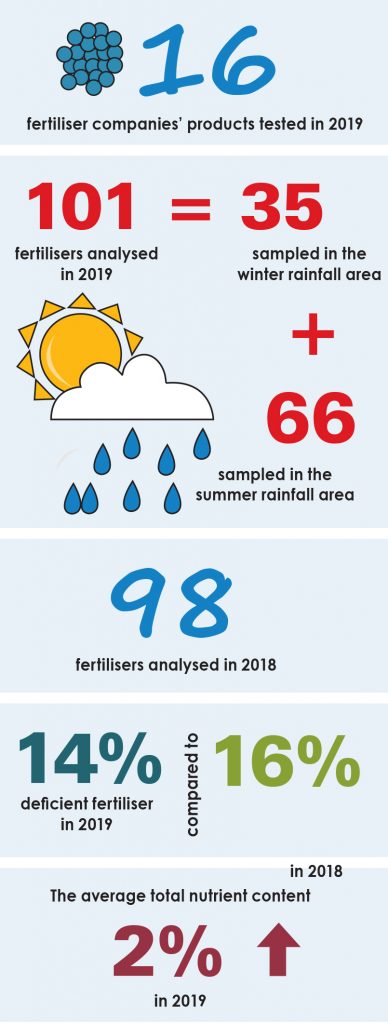
Officials from the provincial departments of agriculture sampled 101 fertilisers from 16 fertiliser companies. 35 fertilisers were sampled in the winter rainfall area and 66 in the summer rainfall area. One gypsum and six limes were sampled in the winter rainfall area. Fertiliser samples were initially analysed by Omnia and the results evaluated according to the regulations stipulated in the Act. 19 fertilisers were non-compliant and 17 had to be re-analysed for a second and some for a third time by independent laboratories to reach a conclusion.
Of the 101 fertilisers, 14% were deficient in one or more nutrients. All of the 100 nitrogen-containing fertilisers were compliant. 78 fertilisers contained phosphorus, of which 8% were deficient. 4% of the 59 potassium-containing fertilisers were deficient. 75 fertilisers contained sulphur, of which 4% were deficient. One of the seven magnesium-containing fertilisers was deficient, while none of the 20 calcium-containing fertilisers were deficient.
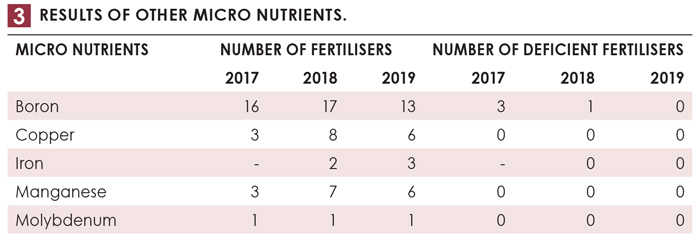
56 fertilisers contained zinc, of which 13% were deficient. 13 fertilisers contained boron, six copper, six manganese, one molybdenum and three iron – all in compliant quantities.
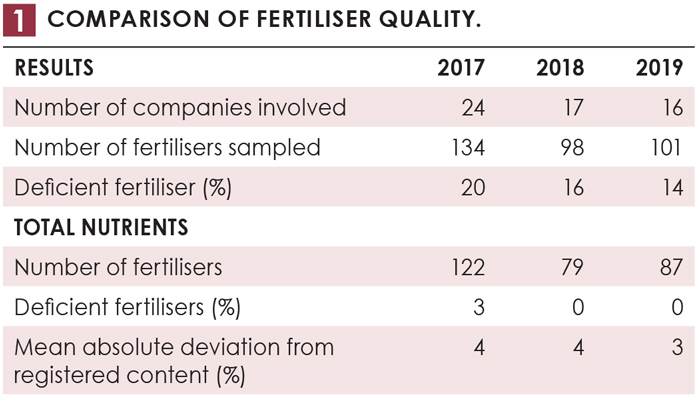
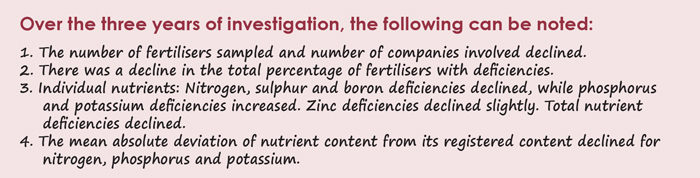
The number of fertilisers sampled and companies involved declined from the 2017 to the 2019 investigation (Table 1). The percentage of fertiliser with deficiencies declined over this period from 20% to 14%, with a trend of less deficiencies of nitrogen, sulphur, boron and total nutrients. In contrast, however, the percentage deficient phosphorus- and potassium-containing fertilisers had an increasing trend.
 One dolomitic lime, one gypsum and five calcitic limes were sampled. Five of the six limes did not pass the 1,7 mm-sieve test – two of which also failed the 0,25 mm-sieve test. Apart from a failed sieve test, one lime also had a calcium carbonate equivalent value below the required threshold. The gypsum did not comply with the required two-sieve test requirements.
 Summary of 2019 results
Summarising statistics on the number of fertilisers analysed and the number of companies involved for 2019 are shown in the infographics. As indicated, 35% of fertilisers were sampled in the winter rainfall area and 65% in the summer rainfall area. Of the 101 fertilisers, 84 were analysed once, one twice and 16 were analysed for a third time to reach a conclusion.
Three fertilisers (9%) from the winter rainfall area had deficiencies, each in only one nutrient. Of the eleven deficient fertilisers (17%) in the summer rainfall area, six were deficient in one, three in two and two in three nutrients.
Apart from the instances of nutrient deficiencies in the fertiliser, the fertiliser industry has managed to achieve some gains. The average total nutrient content (nitrogen plus phosphorus plus potassium) was 2% higher in 2019 than the average registered content. The nutrient content accuracy also improved for nitrogen, phosphorus and potassium as indicated by the declining absolute deviation.
 Trends from 2017 to 2019
Some relevant statistics for the various fertilisers sampled in the 2017, 2018 and 2019 investigations are displayed in Table 2 and Table 3. These values are mainly self-explanatory. Figures for copper, iron and molybdenum are not shown as only a few fertilisers contained these nutrients, which were also never deficient.
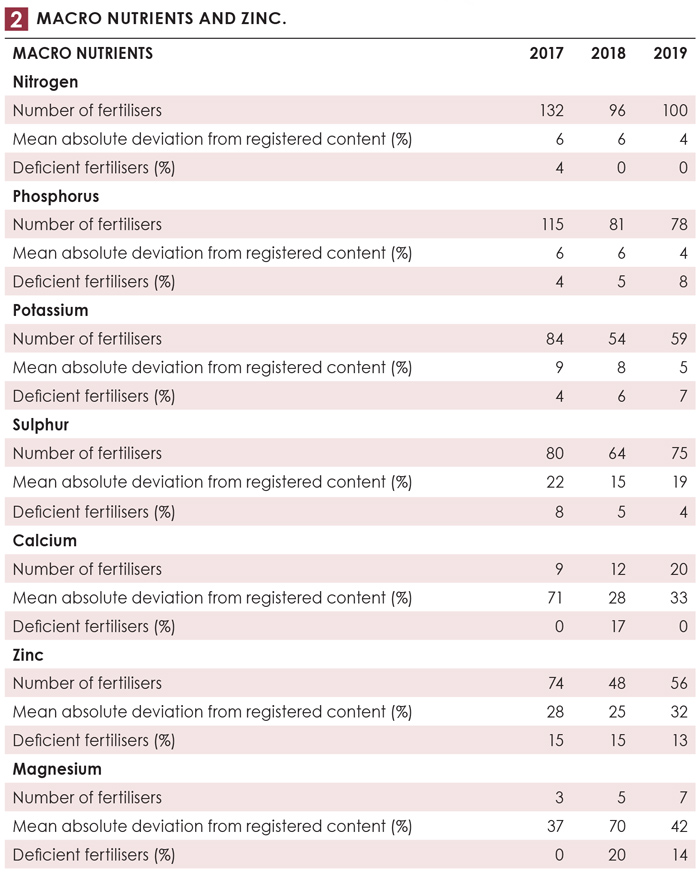
 It should be kept in mind that the same number of fertilisers was not sampled in the past three years, nor the same companies or number of samples from each company. Apart from the number of fertilisers and companies involved, percentage deficiencies and mean deviations should be seen as trends rather than exact comparable values.


