


Department of Agricul-tural Economics, Univer-sity of the Free State
 Dr Dirk Strydom,
 Marketing, NAMPO and Research Coordination lead, Grain SA
 Luan van der Walt, agricultural economist, Grain SA
10 December 2021 – Extensive research done by the Agricultural Economics Department of the University of the Free State has demonstrated that most of the issues experienced in the differential system can be accommodated in a new and innovative methodology to determine location differentials.
The proposed system is based on the spatial supply and demand of the product and – very importantly – takes into consideration all points of processing and the impact this will have on demand for product from each JSE-registered delivery point.
By considering all this information and using linear programming, the methodology is able to construct location differentials, including a zero-differential area, across multiple processing points. There is no longer a requirement for a single reference point of demand as all points are included in the new methodology. Furthermore, the system also has a dynamic component, accommodating possible trends in the market structure of the product. Market concentration is, to some extent, neutralised by location differentials that reflect actual cash prices. The functioning of the system and improved methodology will be explained in the following paragraphs.
Reality of multiple processing points
Randfontein’s share as a processing hub has declined steadily over time for all grains and oilseeds. In the case of soybeans, only an estimated 10% to 15% of processing capacity is situated in Randfontein itself. The determination of location differentials that ensure price indifference has become more and more complex.
The reality of multiple processing locations and the difficulty of getting correct transport cost figures, led to a situation shown in simplified format in Figure 1.
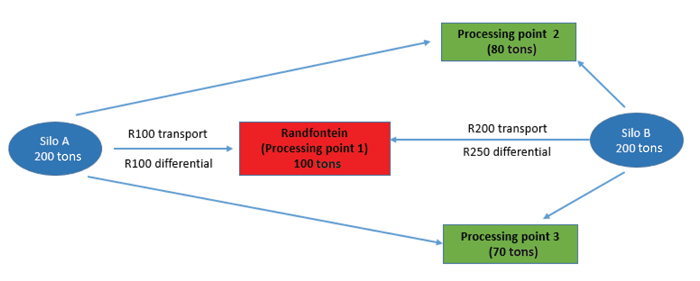
Silo B’s location differential only considers the transport cost to Randfontein, but does not consider the demand from the two processing points in green, one with demand for 80 tons and the other for 70 tons. The overcompensating differential for silo B would normally not be a problem. Because of basis premiums established in the spot market, the two processing plants nearby would also compete for the tonnages from silo B. The quantity available at silo B of 200 tons is less than the combined demand from the three processing plants. The three processing plants, especially two and three, will be in competition and pay a premium to ensure stock at silo B. Randfontein will have to get part of its stock at silo A. This competition for stock at silo B from three different processing plants will imply the published location differential is irrelevant in this instance.
 The reality of market concentration
Although the illustration in Figure 1 is correct in some cases, there are also silos where a scenario as depicted in Figure 2 applies.
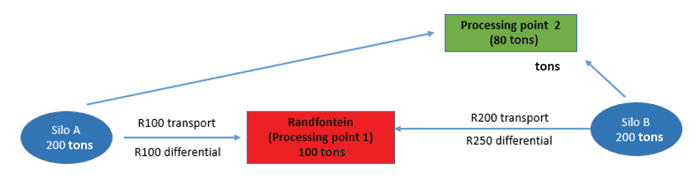
The quantities required by the two processing points are less than the total quantity available at silo B. There is no need for a premium and Randfontein can procure all its stock from silo B, while silo receipts from silo A will be redelivered again and again. Figure 2 illustrates the presence of market concentration, which necessitates an improved approach to determining location differentials. Whilst the location differential methodology only considers transport costs and does not include the various points of demand, this will continue to exacerbate the challenge of determining effective location differentials. To more accurately reflect the spot market pricing dynamics, why not include all processing points in the location differential methodology, thus bringing their influence on each other into account? Recognising fluctuating supply and demand levels will also improve the location differential methodology.
Two processing plants: an example
If there was, for example, only two soybean processing plants in South Africa, one in Mokopane and one in Standerton, their respective supply points can be seen in Figure 3.
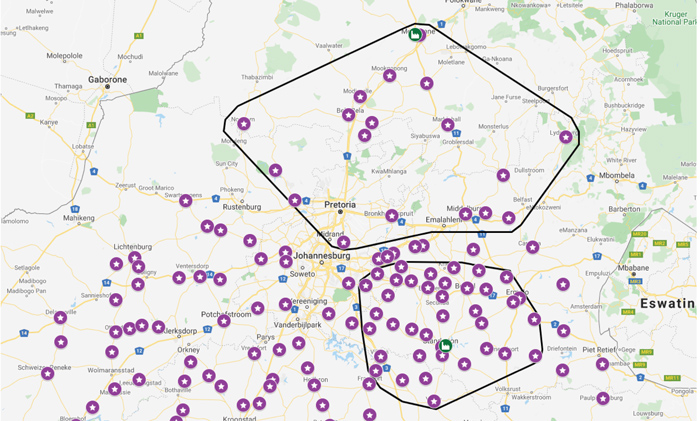
The purple stars in Figure 3 represent registered soybean delivery points and the two green factory symbols represent the processing plants. The stars inside each polygon are the lowest cost silos for the two plants to get their yearly stocks from. The silos inside the polygons will not need a location differential because all redeliveries will be accepted at some time by either the Standerton or the Mokopane plant to fulfil their demand criteria. The silos outside the polygons will all need a location differential to recognise the fact that these points are outside the demand area. This will avoid excessive redeliveries from these sites.
Multiple processing plants
The reality of soybean processing in South Africa is that there are eight facilities that need to be supplied by the different soybean silos. These plants, together with their optimal procurement silos, can be seen in Figure 4 (Winterton is excluded because of an image space constraint).
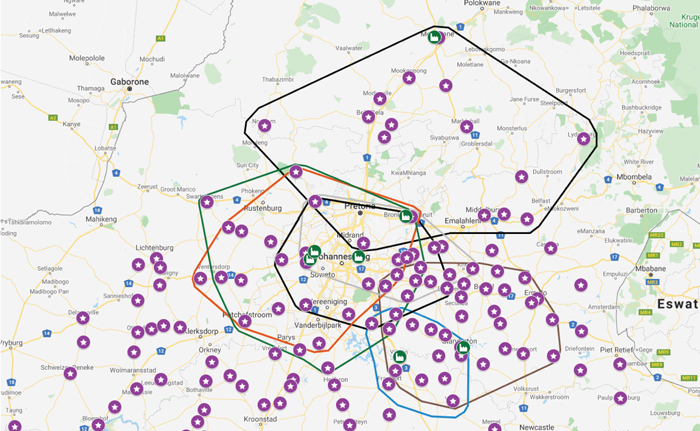
It is clear from Figure 4 that there are a large number of silos which are optimal for more than one processing point. This implies that silos outside of the polygons will also be utilised to supply the needed soybean tonnage, while others will still be left unutilised. The question now is: Which silos will not be utilised and will therefore require a location differential in order to be price indifferent? Although the answer can, in theory, be calculated by hand, millions of combinations must be tested before a solution will be reached where every processing plant have adequate supplies, while keeping overall procurement costs at an optimum level.
This can, however, relatively easily be done by a modelling technique called linear programming, where a computer will weigh all the combinations in a short time and then produce an optimal answer. The answer provided by applying linear programming to the problem is a close approximation of real-world procurement decisions. Figure 5 illustrates which registered silos will be utilised and which registered silos will have redelivery problems without location differentials.
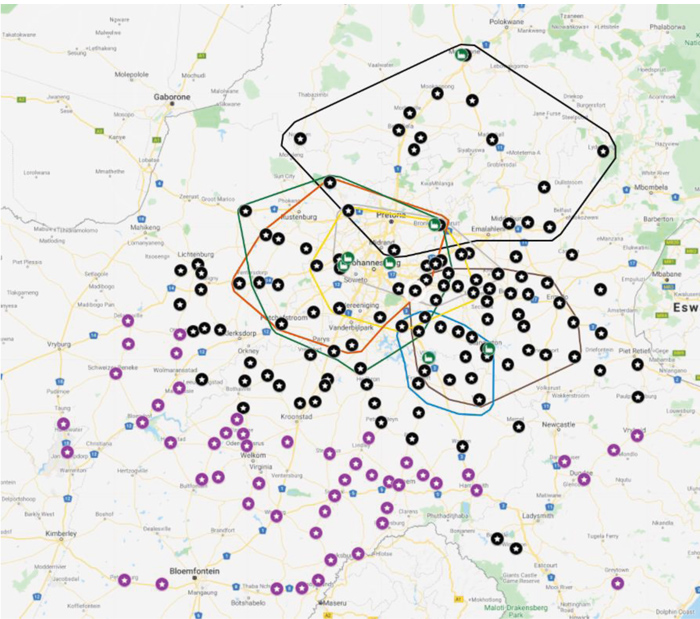
The term ‘price indifferent’ as used in this article in essence implies that through the use of location differentials, buyers who receive deliveries will – should they have required physical product close to any of the processing plants – be placed in a neutral position.
In Figure 5, the JSE-registered soybean silos are divided into black stars and purple stars. The black stars are silos that will be utilised due to their proximity to the processing plants, while the purple silos will require a location differential adjustment to be price indifferent. The linear programming model can also calculate the size of the location differential required at each silo to be price indifferent.
Location differentials for indifferent ex-silo prices
Figure 6 is a graphic summary of soybean location differentials as calculated by the supply and demand model.
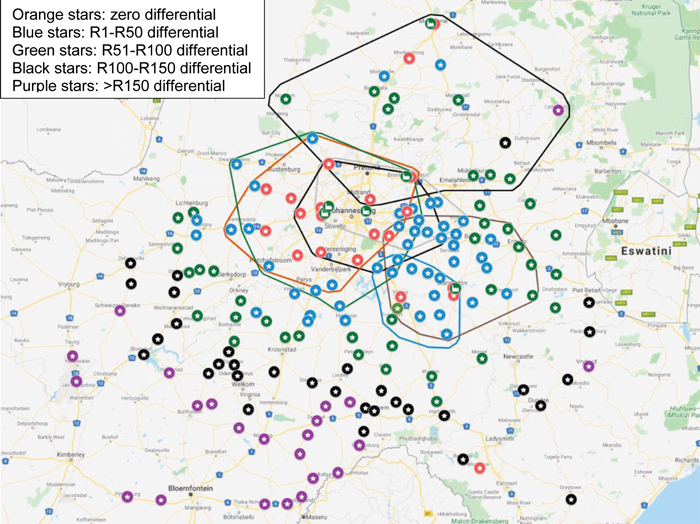
The silos with the largest location differential are Thaba ’Nchu and Tweespruit near Lesotho. It is clear from Figure 6 that the size of location differentials increases as distances from processing plants get larger. The new proposed model, therefore, in a number of ways still relies on similar thinking to the current location differential. However, instead of only having Randfontein as a reference point, the various processing points are all considered and product that is furthest away from this will still see the largest location differential.
In conclusion
The proposed methodology aims to calculate the differentials as close as possible to the cash market by using multiple processing points as a reference. Given the South African market structure with a large number of delivery points and the financial structure where more than 80% of the crop is produced under production finance, the proposed methodology provides the opportunity to have a marketing year starting point close to the realities of the physical market.
This is still very much theoretical and market sentiment and seasonality will continue to utilise premiums to facilitate preferences and trade. This new methodology will move away from the reliance on a single reference point for the derivatives contract, but rather consider all points of processing. It will also introduce the concept of a zero differential for selected sites and from there continue to apply a location differential to JSE delivery points depending on their distance from the processing points.


