


Corné Louw
senior economist, Grain SA,
corne@grainsa.co.za
Ikageng Maluleke
agricultural economist, Grain SA,
ikageng@grainsa.co.za
Since the beginning of 2021 international fertiliser prices have been rising steeply. However, for the better part of 2021, the rand has been strong, therefore moderately cushioning the local industry against the total impact of international price increases.
South Africa being a major importer of fertiliser means international availability and price of fertilisers have a direct impact on a producer’s bottom line. International fertiliser prices in August, except for potassium chloride, have hit record highs. The contribution of fertiliser towards production costs is between 30% and 50% – depending on the crop – and therefore significantly impacts profitability.
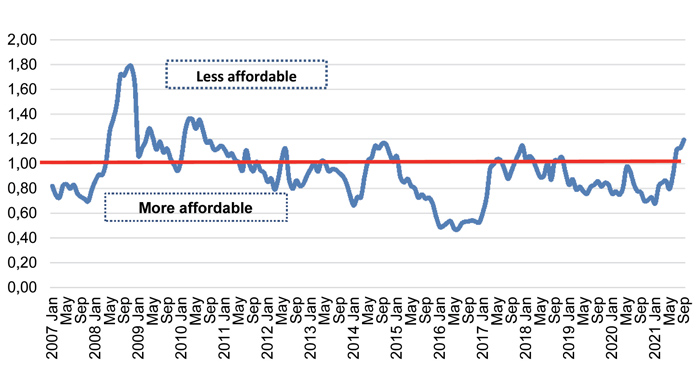
Relative affordability of fertiliser
Using a relative ratio between the relationship of the fertiliser price and the market price of grains, an indicator of the relative affordability of fertiliser can be obtained. For example, if maize prices rise and fertiliser prices remain constant, fertilisers would be relatively more affordable. However, should fertiliser prices rise but the maize price remains constant, fertilisers will be relatively more expensive. Grain SA has developed an affordability index, enabling producers to determine and compare the affordability of fertilisers with previous years.
The affordability index is the ratio of the price of urea to the maize price at a given time. An affordability index number above 1 indicates that fertilisers are less affordable compared with the base year, while a number below 1 stipulates more affordability. Graph 1 shows that fertiliser is currently less affordable when compared to the base year (2006) and the period between 2015 and 2020, where the index was below 1. Since the beginning of 2021, fertiliser prices have been rising, while maize prices have remained relatively constant. What is clear from the graph is that although fertiliser prices are on record high levels, the relative affordability is still better than in 2008, when fertiliser prices were also on record highs. The difference in the current situation is that maize prices are also relatively high, making fertiliser more affordable compared to 2008.
Source: Grain SA
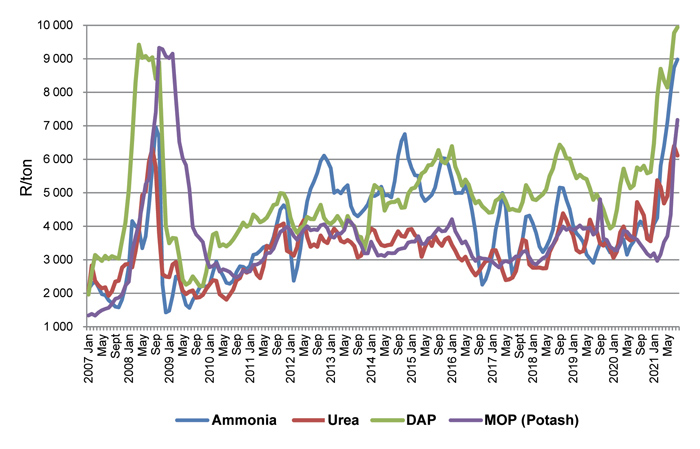
International price movements
Graph 2 shows the international fertiliser prices in rand terms. Since 2007, except for the spike in 2008/2009, the trend has generally been downward until late 2020, where there is a sharp upward movement. Between 2007 and 2021, international fertiliser prices increased significantly in rand terms: ammonia by 427%, potassium chloride by 327%, DAP by 220% and urea by 197%. In the same period, the rand weakened by about 105%. The extent of increases is determined by the exchange rate.
Source: Grain SA
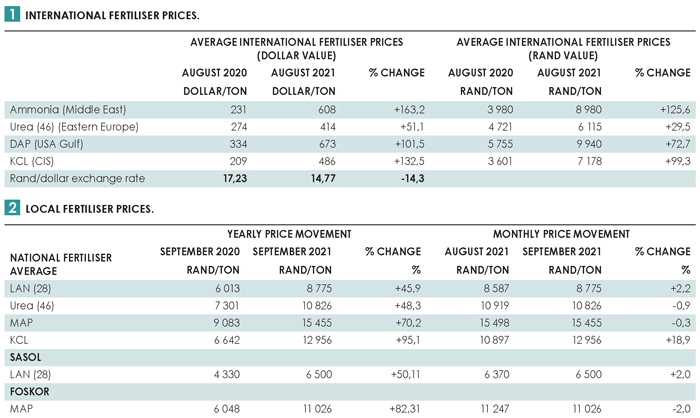
All international fertiliser raw material prices in dollar terms have increased significantly in the past year, indicated on the left side of Table 1. The exchange rate strengthened by 14,3% from August 2020 to August 2021 – a stronger rand means imports can be brought in relatively cheaper. The right side of Table 1 shows international fertiliser prices in rand terms. International prices of ammonia, urea, DAP and potassium chloride increased by 125,6%, 29,5%, 72,7% and 99,3% respectively during that period.
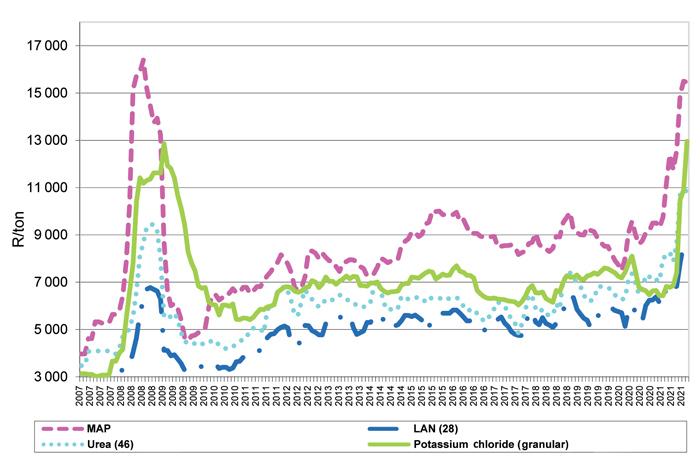
Local price movements
Graph 3 indicates that local fertiliser price trends correlate with international prices. Like the observation in Graph 2, besides the spike in 2008/2009, local fertiliser prices were relatively sturdy until the sharp increases earlier in 2021. Between September 2020 and September 2021 local fertiliser prices increased significantly: LAN by 45,9%, urea by 48%, MAP by 70% and potassium chloride by 95%.
Source: Grain SA
Table 2 indicates the average fertiliser prices between September 2020 and September 2021; the table further indicates individual price changes for Sasol’s LAN and Foskor’s MAP in the same period, which shows a 50% and 82% increase respectively. The right side of the table shows what has happened to local fertiliser prices over the past month. Both LAN and potassium chloride show increases of 2,2% and 18,9% respectively, while urea and MAP have decreased by 0,9% and 0,3% respectively. Regarding the individual manufacturers, Sasol’s LAN increased by 2% and Foskor’s MAP decreased by 2%. South Africa is currently faced with a shortage of ammonia due to a drop in the supply of natural gas from Mozambique, impacting the whole nitrogen value chain.
Expectations for the rest of 2021
The above illustrations of increasing international and local prices indicate why the affordability of fertiliser is low. Unfortunately, it does not seem like there is an expected decrease in the near term. As fertiliser makes up so much of a grain and oilseed producer’s variable production costs, this will again put the profitability of grain production under pressure. At this point, a strengthening rand and stable or higher grain prices would help to cushion the industry against diminishing profits.


