


manager: Laboratory,
The Southern African Grain Laboratory NPC
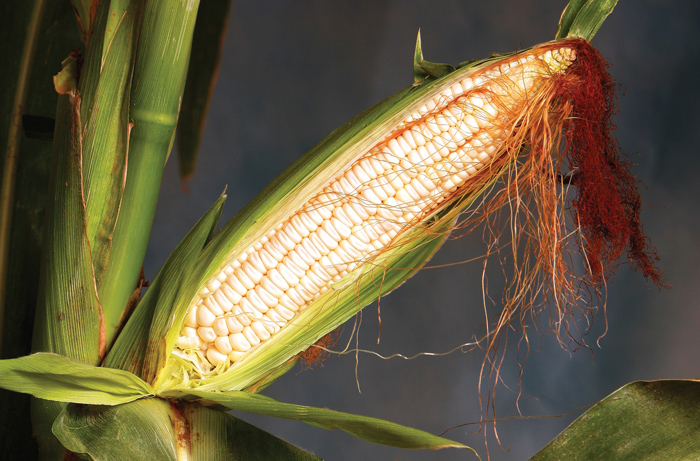
The 2018/2019 maize production season is represented by the results of the 22nd annual maize crop quality survey. A total of 808 composite samples, representing white and yellow maize from 28 of the 36 production regions in South Africa, were received and analysed to determine the quality. The samples consisted of 404 white and 404 yellow maize samples.
RSA grading quality
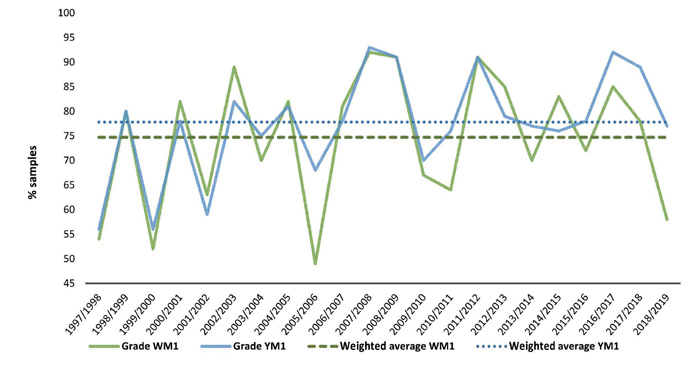
The maize crop was of below average quality as far as white maize was concerned, with only 58% of white maize graded as maize grade 1 (WM1). Last season this figure was 78%. The yellow maize was of average quality with 76% graded as grade 1 (YM1), compared to the 89% of the previous season. Please see Graph 1 for the percentages of grade 1 samples (white and yellow) per season since commencement of the annual maize crop quality survey in 1998.
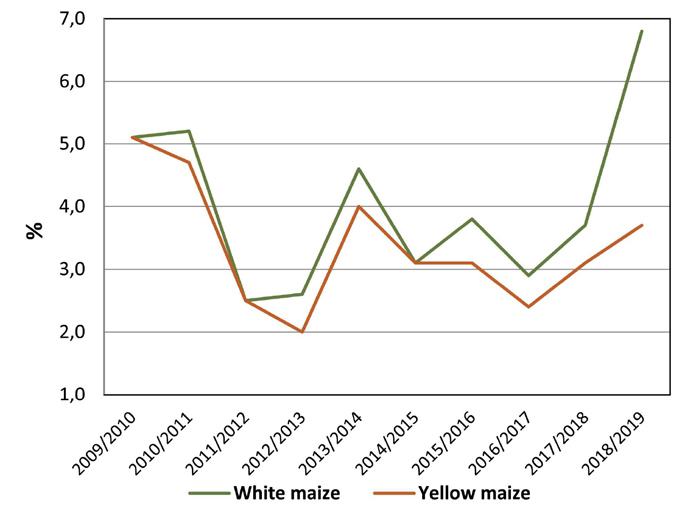
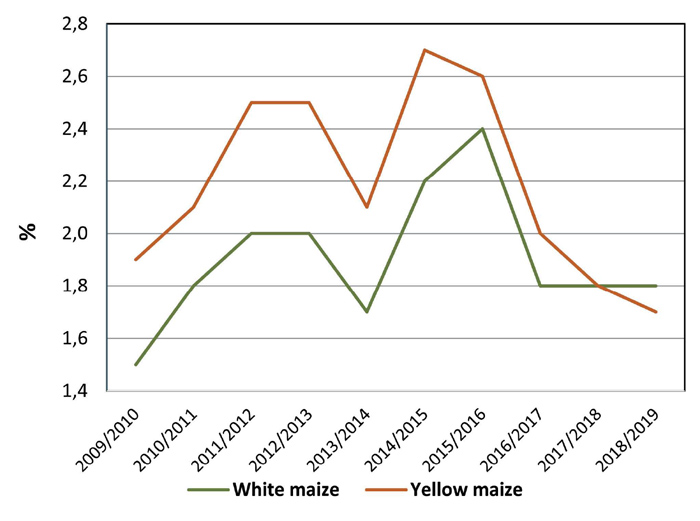
This season the percentage total defective kernels above and below the 6,35 mm sieve (8,7% for white and 5,4% for yellow maize) was respectively 3,2% and 0,5% higher than the previous season. Defective white maize kernels above the 6,35 mm sieve made the largest contribution to the increase in the percentage total defective kernels, increasing from 3,7% last season to 6,8% this season. The percentage defective kernels below the 6,35 mm sieve was equal to last season’s average, namely 1,8%. Please see Graph 2 and Graph 3 for the percentage defective kernels above and below the 6,35 mm sieve respectively over ten seasons.
The average percentage Diplodia-infected kernels in white maize increased from 0,1% to 0,4% this season and in yellow maize from 0,2% to 0,9%. Fusarium-infected kernels decreased in both white and yellow maize compared to the previous season, from 0,9% to 0,3% in white and from 1,2% to 0,3% in yellow maize.
Furthermore, the number of samples downgraded to class other maize (COM) as a result of the percentage foreign matter exceeding 0,75%, increased from four each for white and yellow maize during the previous season to 23 samples for white and 18 samples for yellow maize. Only one white and one yellow maize sample each were downgraded to COM as a result of other colour maize that exceeded 10% and 5% (maximum permissible deviation for grade 3) respectively. The average percentage combined deviations of white maize was 9,3% compared to the 5,9% of the 2017/2018 season and that of yellow maize was 5,7% compared to 5,1% previously.
Physical quality characteristics
Test weight determination is routinely done at most intake points locally. White maize had an average test weight of 75,9 kg/hl compared to the 76,9 kg/hl of yellow maize. White maize’s average test weight was 1,1 kg/hl lower than the previous season and that of yellow maize 0,3 kg/hl lower. The test weight in total varied from 61,0 kg/hl to 83,6 kg/hl.
The 100-kernel mass (‘as is’ basis) of white maize was 33,4 g and averaged higher than yellow maize (30,6 g) as in previous seasons. Both the averages of white maize and yellow maize were approximately 1 g lower than last season. The percentage white maize kernels above the 10 mm sieve decreased by 1,6% compared to the previous season. The percentage yellow maize kernels above the 10 mm sieve decreased by 2,8%. The percentage yellow maize kernels above the 10 mm sieve was on average 16,3% lower than white kernels and the percentage yellow kernels below the 8 mm sieve 13,3% higher than that of white maize.
Both white and yellow maize were more susceptible to breakage than during the previous season (white maize to a greater extent). The percentage stress cracks observed varied overall from 1% to 58% and averaged 17% for white and 13% for yellow maize. The average stress crack percentages were the highest of all the seasons since 1999/2000 when stress crack analyses were commenced. Stress cracks are determined by visual inspection of 100 whole maize kernels, examined on top of a light box, for small internal cracks in the endosperm. Some kernels may have two or more internal cracks. Any form of stress may cause internal cracks, for example rapid moisture loss in the field, during harvest or during drying.
The milling index obtained from the SAGL Milling Index 2019 model developed on the FOSS NIT Infratec 1241 generation 3 standard version grain analyser, varied from an average of 78,7 for white maize to 79,5 for yellow maize. Milling index (MI) values can be evaluated according to the following scale: MI <40 (soft), 40 – 60 (medium), 60 – 80 (moderately hard), 80 – 100 (hard) and >100 (very hard). Grit Yield (GY) values averaged 64,4 for white maize and 64,6 for yellow maize.
Roff milling and whiteness index
The average percentage extraction of total meal in white maize obtained with the Roff mill, averaged 76,0% (3,1% lower than the previous season) and varied from 67,7% to 80,5%.
Whiteness index (WI) averaged 30,2 for unsifted and 20,3 for sifted maize meal. Sieving the sample eliminates variation in the readings due to particle size differences. The WI of the previous season averaged 29,8 and 19,2 for unsifted and sifted maize meal respectively.
The higher the WI value obtained, the whiter the meal sample. The main contributing factors causing differences in WI values are the presence of other colour maize like yellow maize, the presence of defective kernels, the type of cultivar as well as the soil composition. The two samples with the lowest sifted WI values this season, namely -7,67 and -5,19, also had the highest percentages total defective kernels (96,7%) and other colour maize (12,9%) respectively.
Nutritional values
The maize industry requested that crude fibre be added to the scope of analysis performed on the annual maize crop quality survey. With the assistance of FOSS, a calibration for crude fibre was developed and added to the existing calibration on the Infratec 1241 grain analyser (NIT) during the previous season. The calibration is updated annually with the latest season’s results. Results are reported on a dry basis.
This season the average fat content of white maize equalled the 4,0% of yellow maize. The ten-year average fat content of white maize is 4,1% and that of yellow maize 3,9%. The protein content of yellow maize averaged 9,2%, which was 0,2% higher than that of white maize. The protein content of both white and yellow maize was slightly higher (0,3% and 0,2% respectively) than in the previous season.
The average starch content of white maize (73,6%) was 0,4% higher than in the previous season and yellow maize (72,7%) averaged 0,7% higher. Ten-year averages for white and yellow maize are 72,9% and 72,8% respectively. The average crude fibre content of white maize was 1,9% and that of yellow maize 2,0%.
Mycotoxins
350 samples were tested for aflatoxin B1, B2, G1, G2, fumonisin (FUM) B1, B2 and B3, deoxynivalenol (DON), 15-acetyl-deoxynivalenol (15-ADON), ochratoxin A, T-2 toxin, HT-2 toxin and zearalenone (ZON) by means of a multi-mycotoxin method using UPLC – MS/MS. The occurrence of these mycotoxins was monitored in the South African maize crop at harvest over the past nine seasons and notable trends are observed.
312 or 89% of the samples contained one or more mycotoxins, an increase of 14% compared to the previous season (2017/2018) and a 27% increase compared to the 62% of the 2016/2017 season’s maize samples tested. The maize samples contained mainly deoxynivalenol (68%), fumonisins (43%) and zearalenone (10%). The presence of deoxynivalenol and zearalenone increased over the past three seasons, but the fumonisin prevalence stayed constant over the same period. Approximately 44% of the samples contained fumonisins.
An increase in the mycotoxin occurrence was observed in all seven major maize production provinces in South Africa this season. The percentage samples with one or more mycotoxins present in the different provinces, showed notable differences and the trends in occurrence confirmed that mycotoxin risk varies significantly between production regions, production seasons and maize class. The following results and notable trends were observed this season:
Aflatoxins
This was only the second season that aflatoxins were found since the survey began in 2010/2011. One white maize sample collected in the Free State (region 23), was contaminated with 48 µg/kg aflatoxin B1 and 95 µg/kg aflatoxin G1 (143 µg/kg total aflatoxins). In the 2014/2015 season, aflatoxins were found in three white maize samples originating from the North West.
Ochratoxin A, T-2 toxin and HT-2 toxin
None have been reported in South African-produced commercial maize since 2010/2011.
DON and 15-ADON
Compared to the previous three seasons, the number of white and yellow maize samples containing DON increased. However, only 4% of white maize samples and 1% of yellow maize samples contained more than 2 000 µg/kg DON (2 000 µg/kg is the regulated maximum allowable level in unprocessed maize for human consumption in South Africa). The concentration ranges of the 68% of samples containing DON are summarised in Graph 4 (white maize) and Graph 5 (yellow maize).
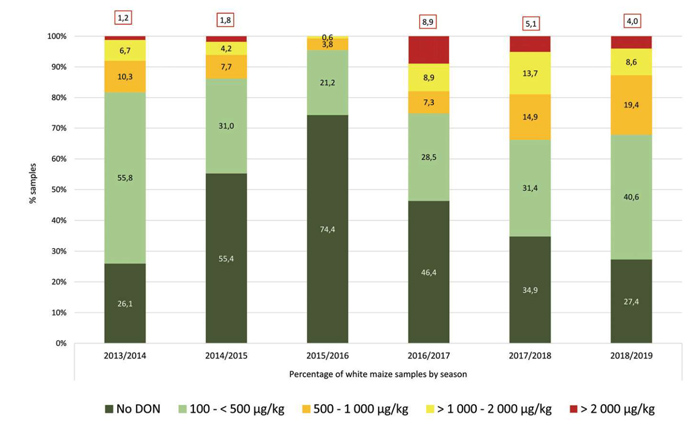
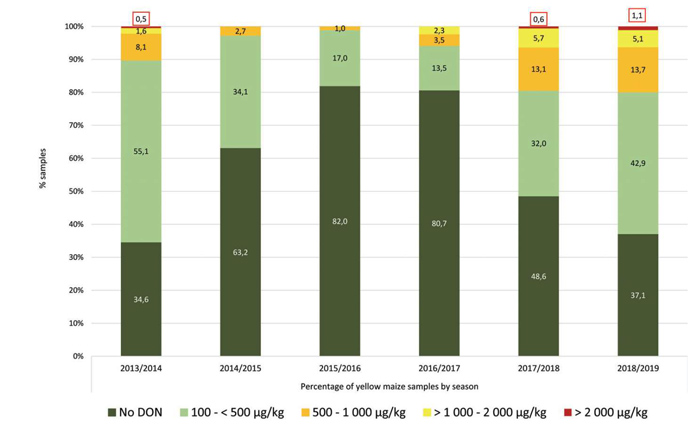
The highest DON concentrations ever reported on the maize crop over the past nine seasons, were found in a white as well as a yellow maize sample this season. The white maize sample, collected in Mpumalanga, contained 11 181 µg/kg DON and the yellow maize sample from KwaZulu-Natal was contaminated with 3 256 µg/kg DON. The annual mean DON concentrations in the seven provinces ranged from 320 µg/kg
to 1 106 µg/kg in white maize and from 269 µg/kg to 1 002 µg/kg in yellow maize.
15-ADON is always only present in samples that contain DON, mostly when the DON concentration is more than 500 µg/kg. In this season, only 17,7% of the 350 samples tested contained 15-ADON, with a mean concentration of 218 µg/kg.
Fumonisins
(FUM total = FB1 + FB2 + FB3)
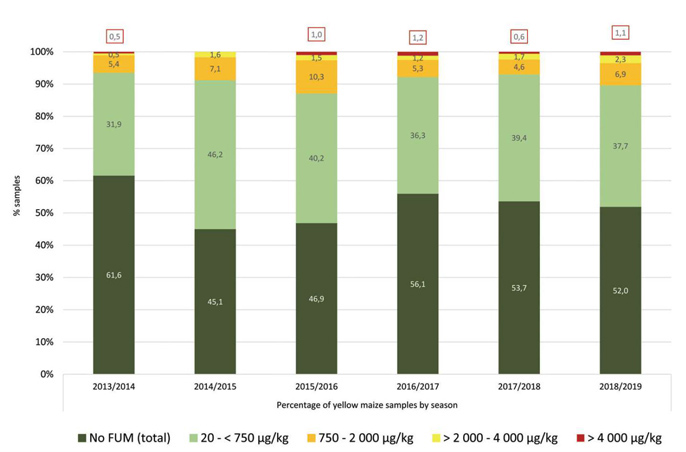
Slightly more yellow maize (48%) than white maize samples (38%) contained fumonisins this season, similar to the previous two seasons. Only 0,6% white and 1,1% yellow maize samples were contaminated with more than 4 000 µg/kg FUM (4 000 µg/kg is the regulated maximum allowable level for FUM B1 + B2 in unprocessed maize for human consumption in South Africa). The concentration ranges of the samples with fumonisins over the past six seasons are summarised in Graph 6 (white maize) and Graph 7 (yellow maize).
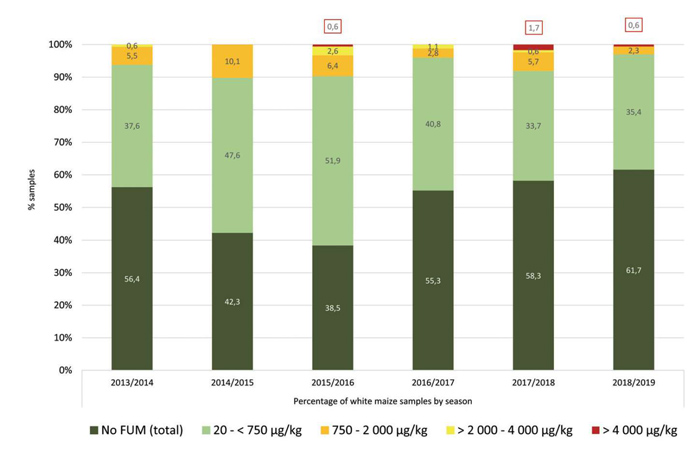
A decrease was observed in the white maize mean FUM concentration in four of the seven production provinces compared to the previous production season. This season’s mean FUM concentration in white maize in Limpopo increased to 2 408 µg/kg (39% increase) because of the high FUM concentration (7 341 µg/kg) found in one of the samples.
The highest concentration fumonisin ever reported in this survey, was found this season in a yellow maize sample collected in Mpumalanga (34 740 µg/kg FUM total). This concentration is eight times more than the second highest FUM concentration reported in an individual yellow maize sample this season.
In yellow maize the mean FUM concentration ranged from 207 µg/kg in the Free State to 2 143 µg/kg in Mpumalanga and only increased in two provinces, namely Mpumalanga and Gauteng.
Zearalenone
For the first time since this survey started nine years ago, zearalenone was found in Limpopo, namely 33 µg/kg in one white maize sample. The highest concentration ZON in an individual sample (957 µg/kg) since 2010/2011, was reported this season in yellow maize from KwaZulu-Natal.
Maize imports and exports during 2019/2020
A total of 509 684 tons of yellow maize were imported from Argentina and Brazil for local use during the period 27 April 2019 to 24 April 2020 according to figures obtained from the South African Grain Information Service (SAGIS). No white maize was imported during this period. 42 samples, 37 representing imported Argentinian maize and five representing imported Brazilian maize, were received at the SAGL for quality analysis purposes. The results of the quality analyses performed on the imported maize are compared to those of the local maize crop of the corresponding grade and period (2018/2019 production season).
Ten samples in total were graded YM2 and one COM. The remainder were all graded YM1 according to South African grading regulations. The average percentage defective kernels above the 6,35 mm sieve for YM1 maize was higher on the imported samples, but lower than that of local maize for YM2 and COM. The average percentage defective kernels below the 6,35 mm sieve were higher than that of local maize. The 100-kernel mass of the imported maize was, in contrast to previous seasons, higher than South African maize. Test weight values of the imported maize were lower on average than local maize as observed during the previous season. The difference in the percentage stress cracks between imported and local maize was smaller than in previous seasons, given the increase in stress cracks on local maize this season. The kernel sizes of the imported maize were smaller than South African maize as in previous seasons – values above the 10 mm sieve were on average 3% to 5% lower. The average protein content of the imported maize was approximately 1,0% lower than that of the South African maize, while the average fat content was 0,3% higher. The starch content of the Argentinian maize compared well with local maize, while the Brazilian starch content was on average 0,5% higher. Crude fibre values were almost identical.
Multi-mycotoxin analyses were done on nine Argentinian and one Brazilian composite sample per shipment. The mycotoxin results did not raise any major concerns. The fumonisin and DON residues on all but one sample from Argentina were well below the national maximum fumonisin (B1 + B2) level for raw maize intended for further processing.
During the season under review, 1 022 141 tons of local white maize and 402 373 tons of local yellow maize were exported to countries in Africa and overseas. Zimbabwe was the largest importer of South African white maize, while Eswatini (Swaziland) was the largest importer of yellow maize.
Sincere appreciation to the Maize Trust for financial support of these annual surveys and to the members of Agbiz Grain for providing the maize crop samples.


