



The 2026/2027 production season is shaping up to be one of the most challenging planning environments producers have faced in recent years. Commodity prices remain under pressure, while input costs continue to be high, with additional uncertainty surrounding global geopolitical developments and the potential influence of an El Niño weather pattern. Under these conditions, careful planning and budgeting will be essential. This article provides an overview of Grain SA’s latest production budgets for the 2026/2027 season.
Assumptions of the production budgets
Grain SA’s annual production budgets provide producers with a useful guideline for comparing the profitability of maize, sunflower, and soybeans across the various summer rainfall regions. Production costs differ from farm to farm due to variations in production practices, infrastructure, management methods, and input choices. Producers should therefore use these budgets as a guideline and adjust them according to their own production systems, input costs, yield expectations, and management practices. The following sections present the assumptions made.
1. Commodity prices
The Safex forward futures contract used in the calculations is as follows:
- White maize to be delivered in July 2027 = R3 800
- Yellow maize for delivery in July 2027 = R3 800
- Sunflower to be delivered in May 2027 = R10 000
- Soybeans for delivery in May 2027 = R7 900
Handling costs, the transport differential, and marketing commission were deducted from the Safex price to calculate a producer/farmgate price. Regional and commodity transport differentials vary according to distance from major delivery points and processing facilities.
2. Yield
Uncertainty regarding production conditions, particularly considering the variability experienced over the past two production seasons, including the current one, makes it difficult to determine expected yields with certainty. Five-year average provincial yields, based on the 2020/2021 to 2024/2025 production seasons, were therefore used to determine the expected yield potential for each crop in the various regions.
3. Interest on production capital
Interest on production capital was calculated using prevailing agricultural financing rates, reflecting the cost of financing variable production inputs over the production cycle. The actual financing cost applicable to individual producers will differ depending on borrowing arrangements, repayment terms, and prevailing interest rates. A calculation of prime + 2% was used to get the production credit percentage of 12,5%.
4. Fixed cost assumptions
Fixed costs included in the budgets represent estimated expenses associated with labour, management, machinery ownership, repairs and maintenance, administration, and other farm overheads. Since these costs differ significantly between farming businesses, producers are encouraged to replace these estimates with farm-specific graphs when evaluating profitability.
5. Insurance assumptions
Insurance costs were included where applicable and are intended to represent the cost of protecting production inputs and harvested grain against selected production and marketing risks. Actual insurance costs may vary according to producer requirements, regional risk profiles, and insurer pricing structures.
6. Input prices
Various assumptions were made when compiling the budgets. For fertiliser, an average of the price lists from major fertiliser suppliers was calculated for nitrogen (N), phosphate (P), and potassium (K) and incorporated into the budgets. Recommendations from Fertasa were used for the nutrient uptake per commodity.
For seed costs, different cultivars commonly used in various regions were used. The assumption was that 100% of new seed was used for maize and sunflowers and 80% for soybeans (assuming that producers would plant 20% of their own seed).
Fuel costs were estimated using forward expectations for the rand/dollar exchange rate and crude oil prices for September 2026, November 2026, and April 2027. These projections suggest that fuel prices could move slightly lower, although certain crop protection products and chemical inputs have increased. No fuel rebates were included in the calculations. Geopolitical tensions in the Middle East, particularly disruptions affecting trade through the Strait of Hormuz, also contributed to higher energy and freight costs, placing additional upward pressure on several agricultural inputs, especially fuel-related expenses.
7. Cost structure
The production budgets consist of variable costs and fixed costs. Variable costs are expenses directly related to the production of a crop, such as seed, fertiliser, herbicides, diesel, and other production inputs. These costs vary according to the area planted and the level of production. Fixed costs, or overhead costs, are expenses that must be paid regardless of whether production takes place. Examples include salaries, management costs, maintenance, and certain loan obligations. Although these costs vary considerably between farms, an estimated amount is included in the budgets to provide a realistic indication of the total cost of production. To determine the full production cost per hectare, fixed costs are added to variable costs.
8. Margin analysis
The analysis of gross margins remains one of the most widely used methods for comparing the relative profitability of different grain crops on a farm. A positive gross margin indicates that variable costs are recovered, while a positive net margin indicates that both variable and fixed costs are recovered. Gross margin is calculated by subtracting total variable costs from gross income. It indicates whether a crop generates sufficient revenue to recover production-related expenses. Net margin is calculated by subtracting total production costs (both variable and fixed costs) from gross income and therefore provides a more complete measure of profitability. A crop may record a positive gross margin but a negative net margin if income is sufficient to cover variable costs but insufficient to recover fixed/overhead costs. This distinction is important when evaluating longer-term profitability and sustainability.
Summer grain production budgets for the 2026/2027 production season
Eastern production regions
Table 1 compares the production costs of maize, sunflower, and soybeans in the Eastern Free State using their respective five-year average yield targets, while maize and soybeans are compared in the eastern Highveld (Mpumalanga). The eastern production regions remain the most intensive dryland production systems included in these budgets. Their higher rainfall and yield potential allow producers to target higher production levels; however, these benefits come at the cost of greater investment in production inputs. Maize production in the eastern Highveld is expected to generate the highest gross income at R22 059/ha, compared to R21 041/ha in the Eastern Free State. However, total variable costs exceed R20 000/ha in both regions, showing the substantial financial commitment required to achieve these yields.
Across all crops, fertiliser remains the highest variable cost, followed by seed, fuel, machinery repairs, and crop protection products. For maize, fertiliser alone exceeds R8 600/ha in the Eastern Free State and R10 000/ha in the eastern Highveld, accounting for more than 40% of total variable expenditure. Soybeans require a considerably lower investment, with variable costs of approximately R13 000/ha and R15 000/ha, while sunflowers remain the least capital-intensive crop at R9 127/ha due to lower fertiliser and crop protection requirements.
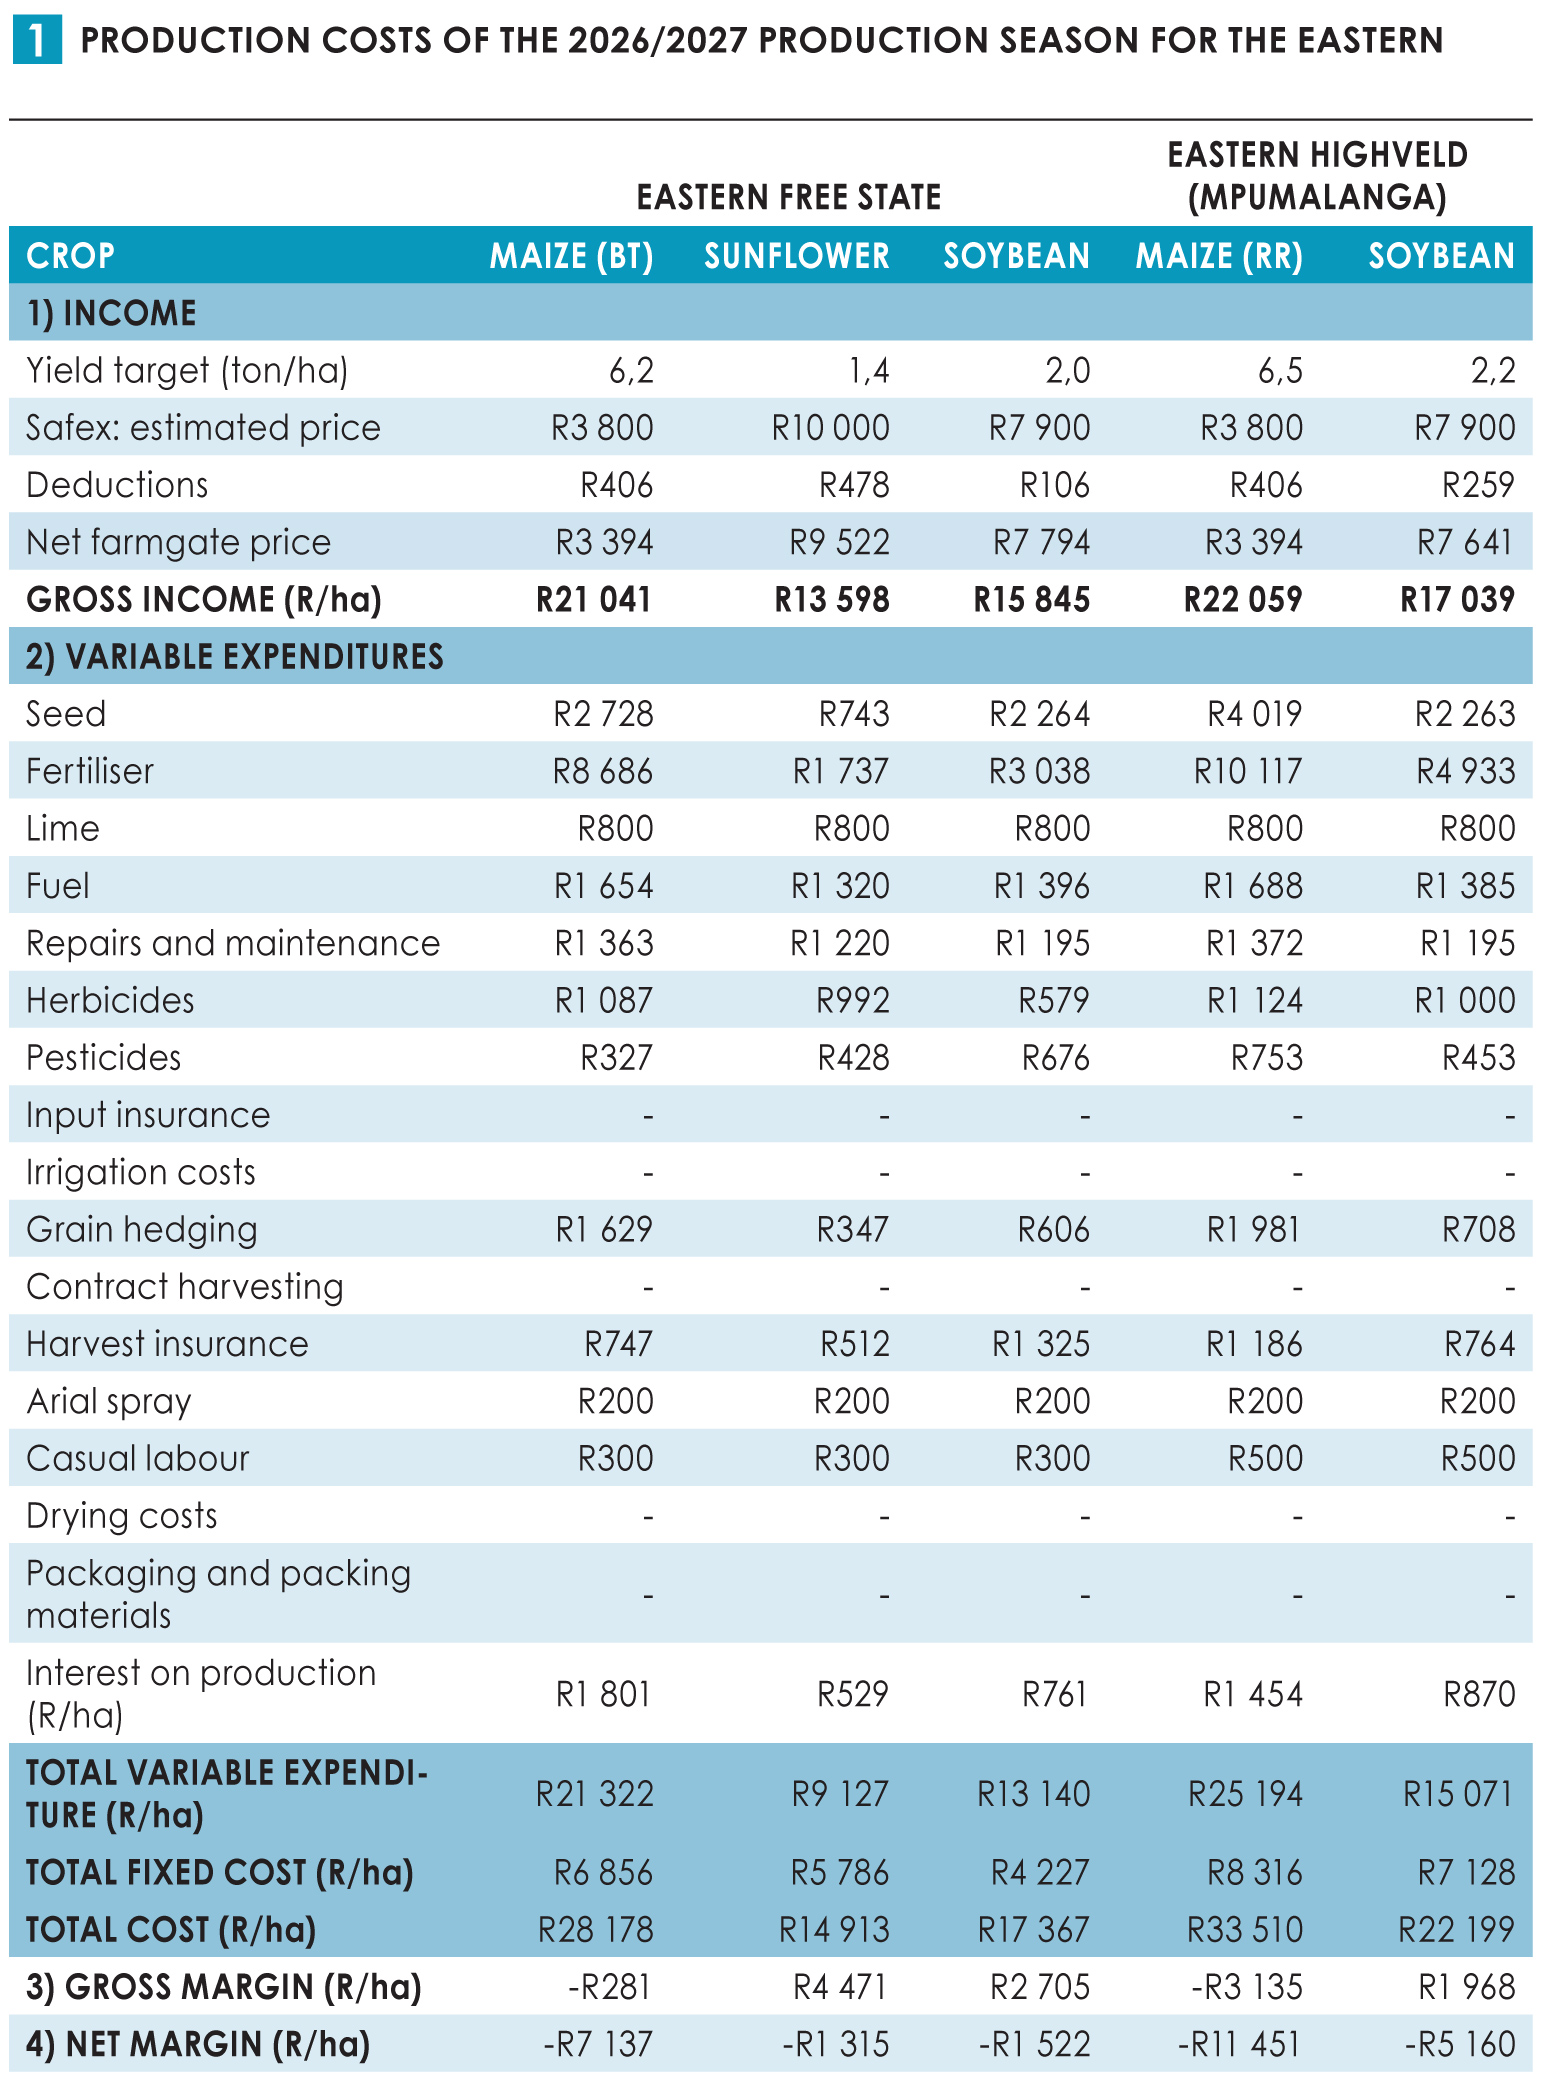
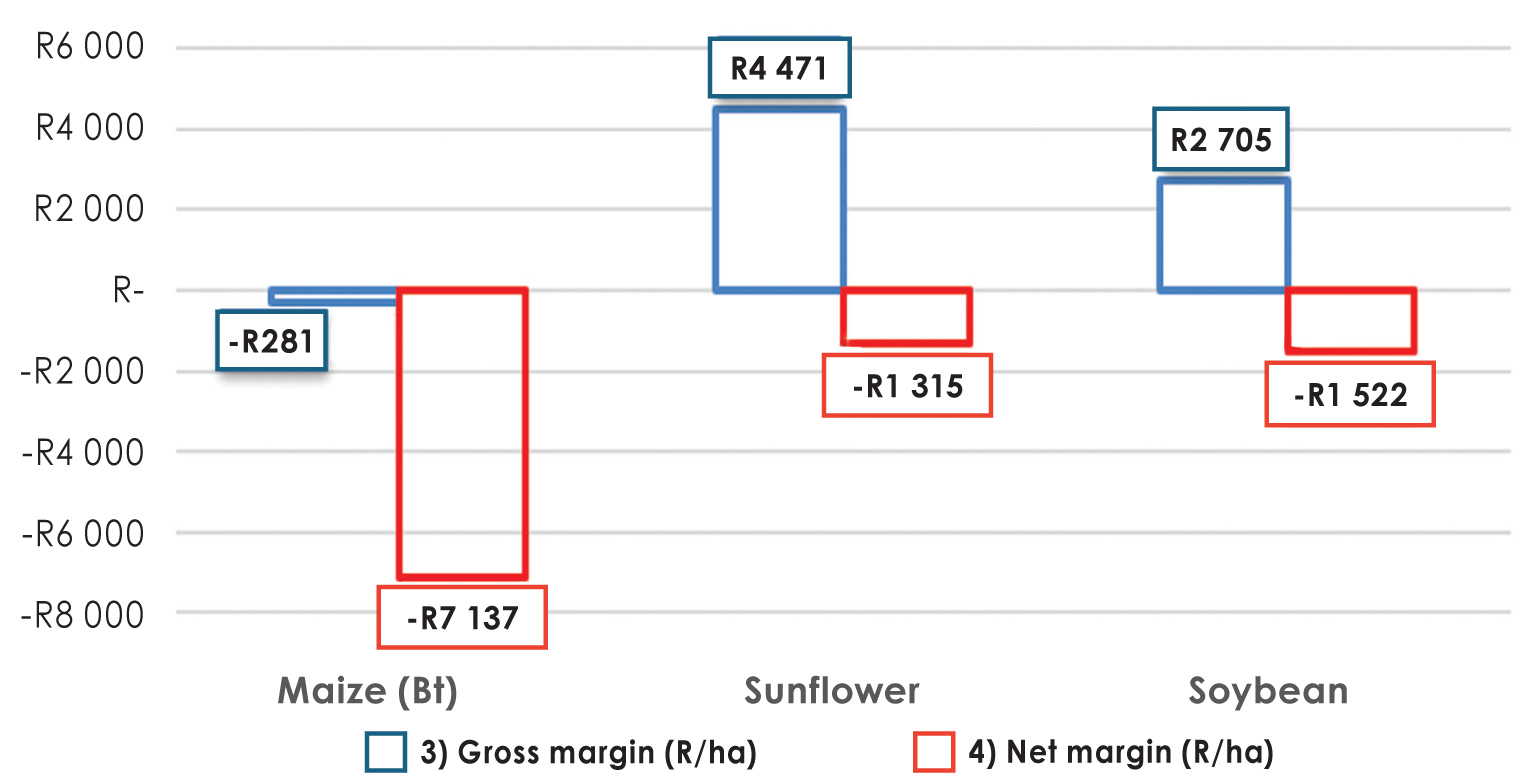
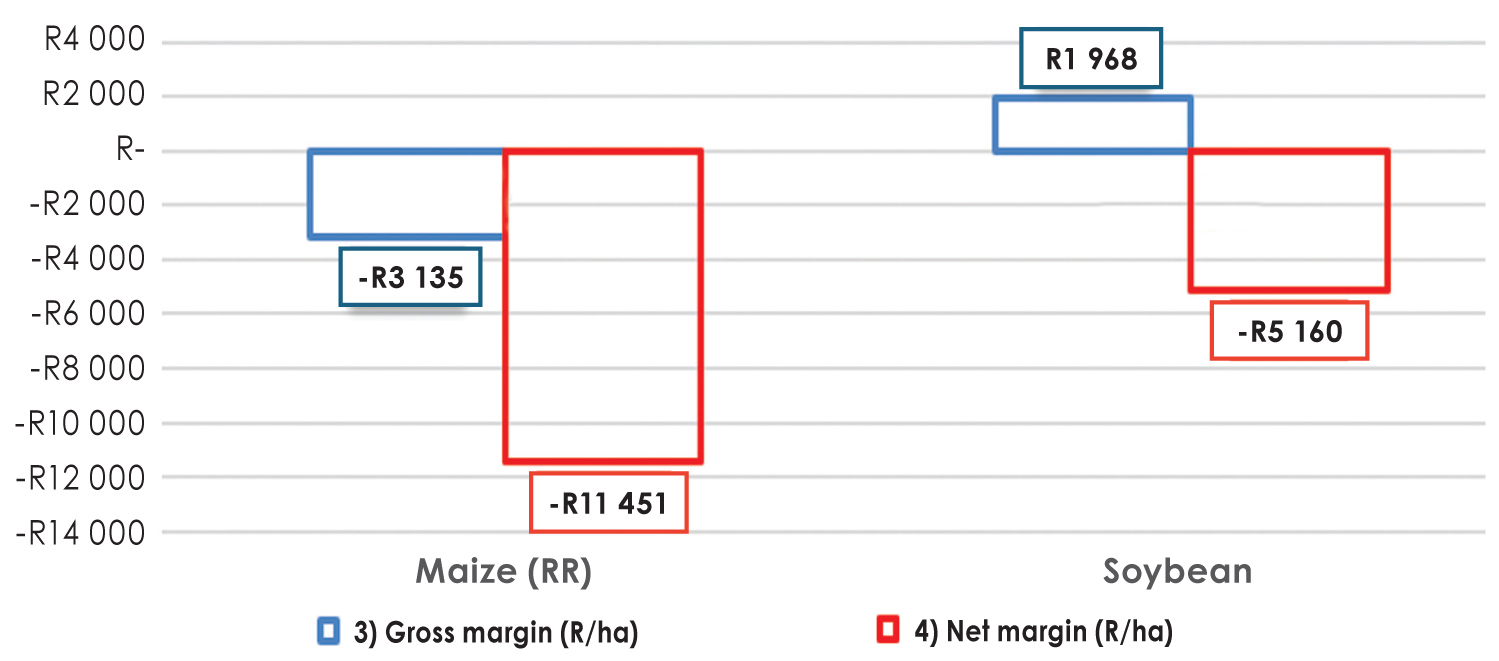
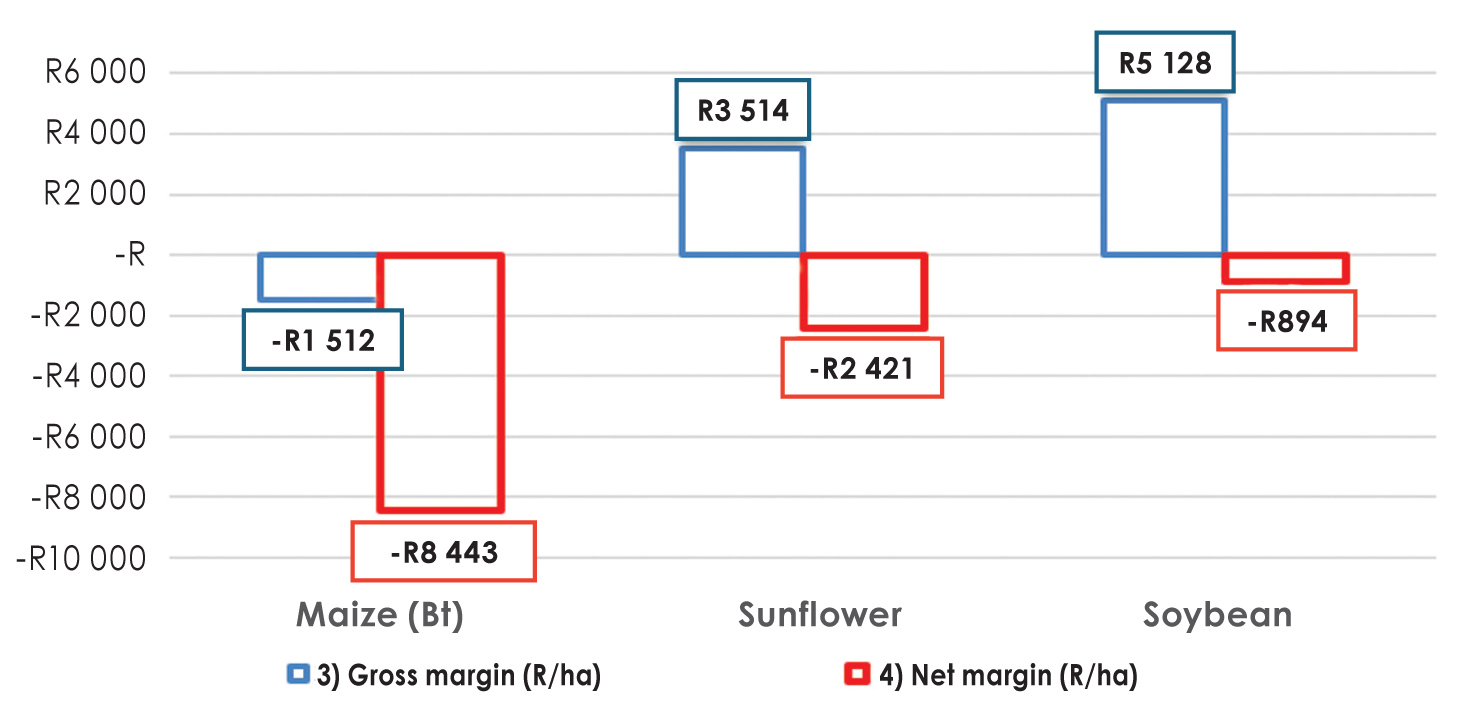
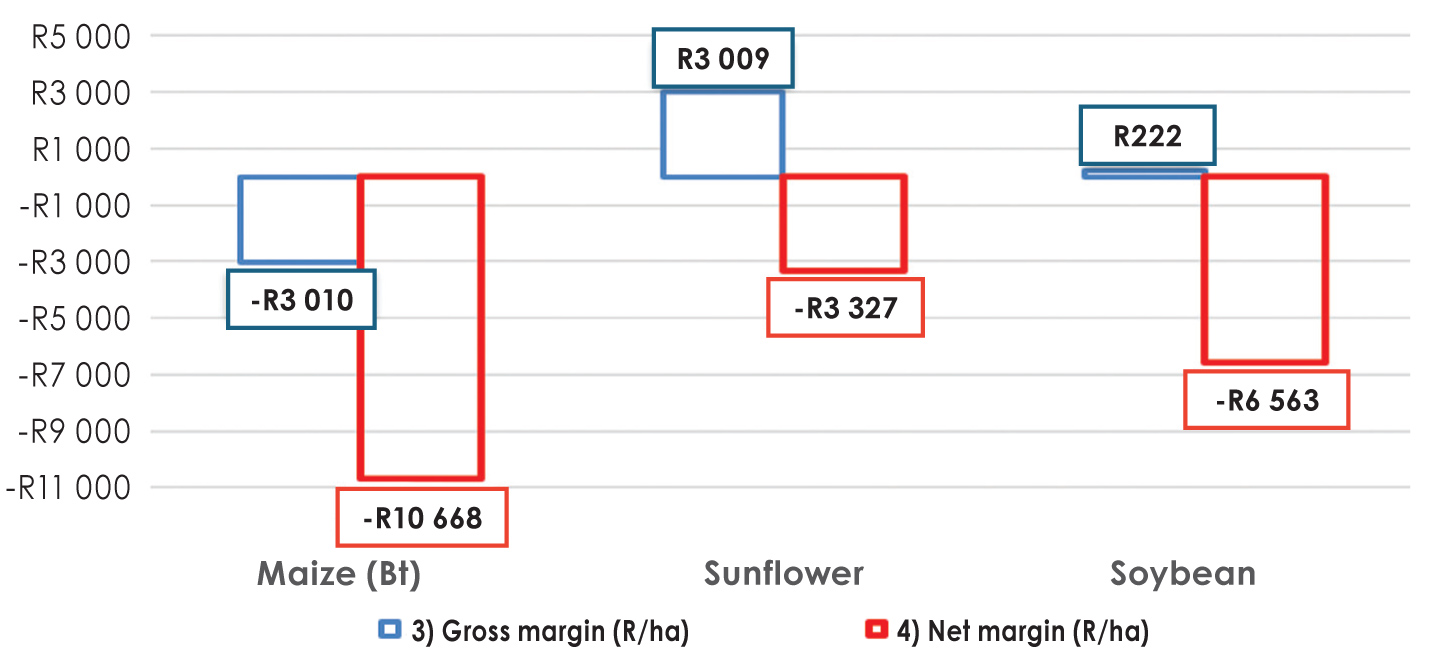
The gross margins shown in Graph 1 and Graph 2 present the information as illustrated and calculated in Table 1 in a chart format. The graph shows a comparison of gross margin (blue bar) as well as net margin (red bar) between these crops. These graphs reflect the pressure that current market conditions are placing on producers. In the eastern regions, sunflower remain the strongest-performing crop from a gross margin perspective, while soybean margins are positive. Maize profitability remains highly dependent on achieving above-average yields and strict cost management. These graphs should not discourage maize production, but rather highlight the importance of achieving target yields, controlling input costs, and implementing sound marketing strategies to improve overall profitability.
Western production regions
Moving to the western regions, production systems become less intensive as lower rainfall reduces the yield potential. Lower production intensity results in reduced expenditure on inputs such as fertiliser and seed, with maize variable costs declining to R19 572/ha in the Northwestern Free State and R15 508/ha in North-West (Table 2). However, the lower cost structure is accompanied by reduced income potential, with maize gross income ranging from R13 000/ha to R16 500/ha. Although fertiliser remains the largest single production expense for maize, lower application rates reduce overall production costs compared with the eastern regions.
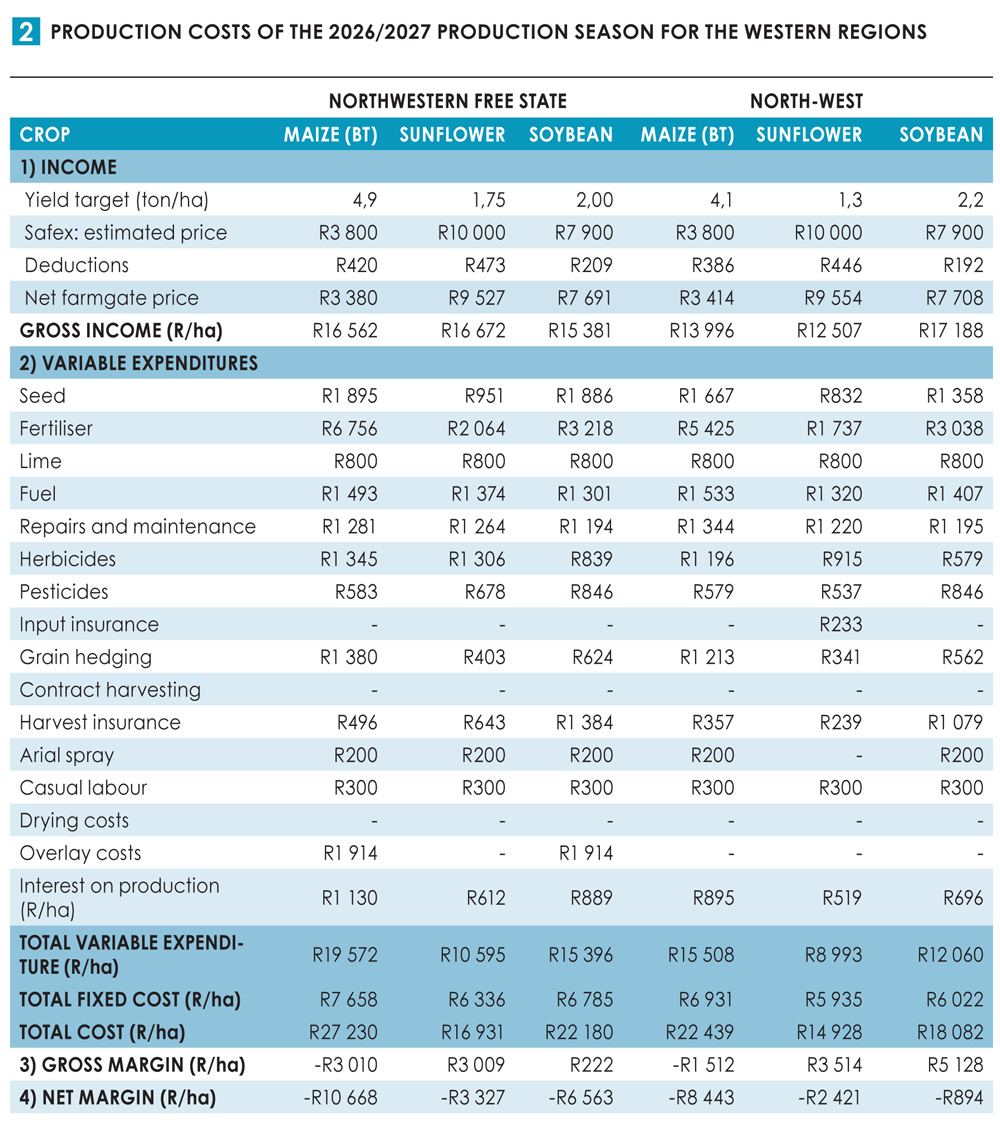
Sunflower remains the most profitable crop in both regions, generating the highest gross margins despite its lower income potential (See Graph 3 and Graph 4). In contrast, soybean production performs particularly well in North-West, where it records the strongest gross margin of R5 128/ha among all crops in the region. Maize, however, continues to face profitability challenges, with production costs exceeding expected returns under current market conditions. These budgets illustrate that lower production costs alone are insufficient to improve profitability when yield potential and commodity prices remain constrained.
Irrigation regions
Table 3 shows the production budgets for the crops under irrigation. The irrigation budgets represent the highest production potential, but also the highest financial risk. Higher yield targets increase expenditure on seed and fertiliser, while irrigation introduces additional costs associated with water, electricity, and irrigation infrastructure. Irrigated maize requires the largest capital investment, with total variable expenditure exceeding R53 000/ha, largely driven by fertiliser and irrigation costs. Although maize generates the highest gross income, current commodity prices are insufficient to offset these production costs, resulting in a negative gross margin (see Graph 5).
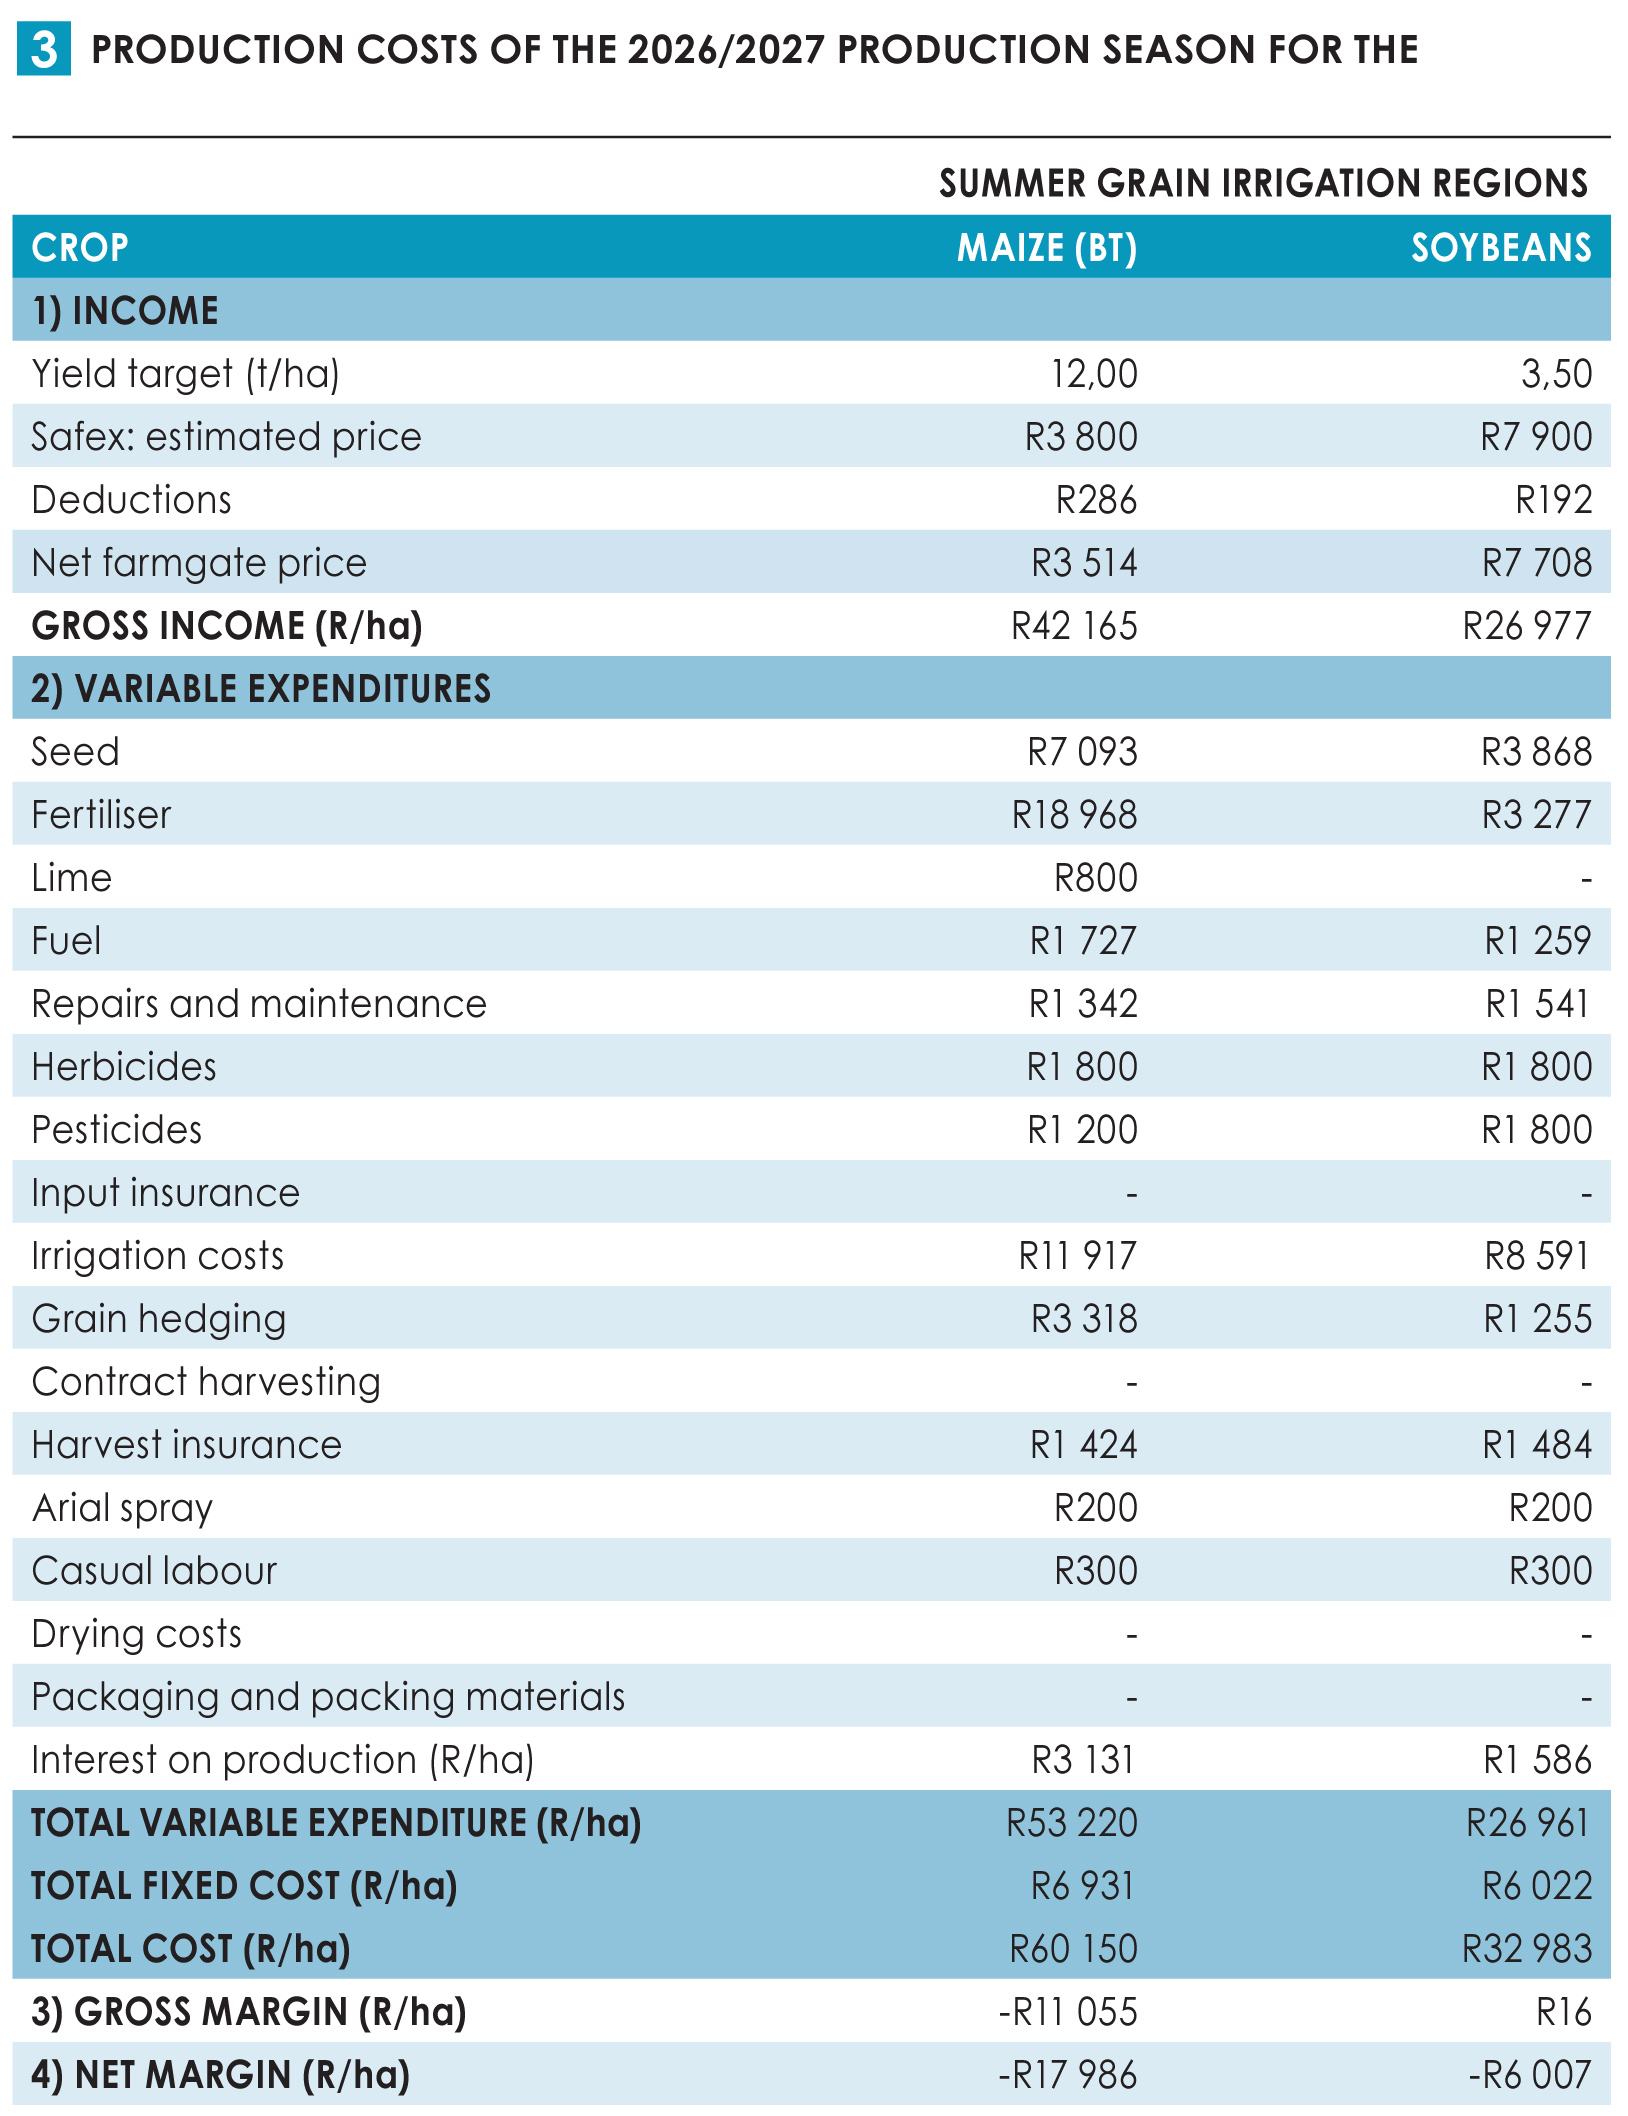
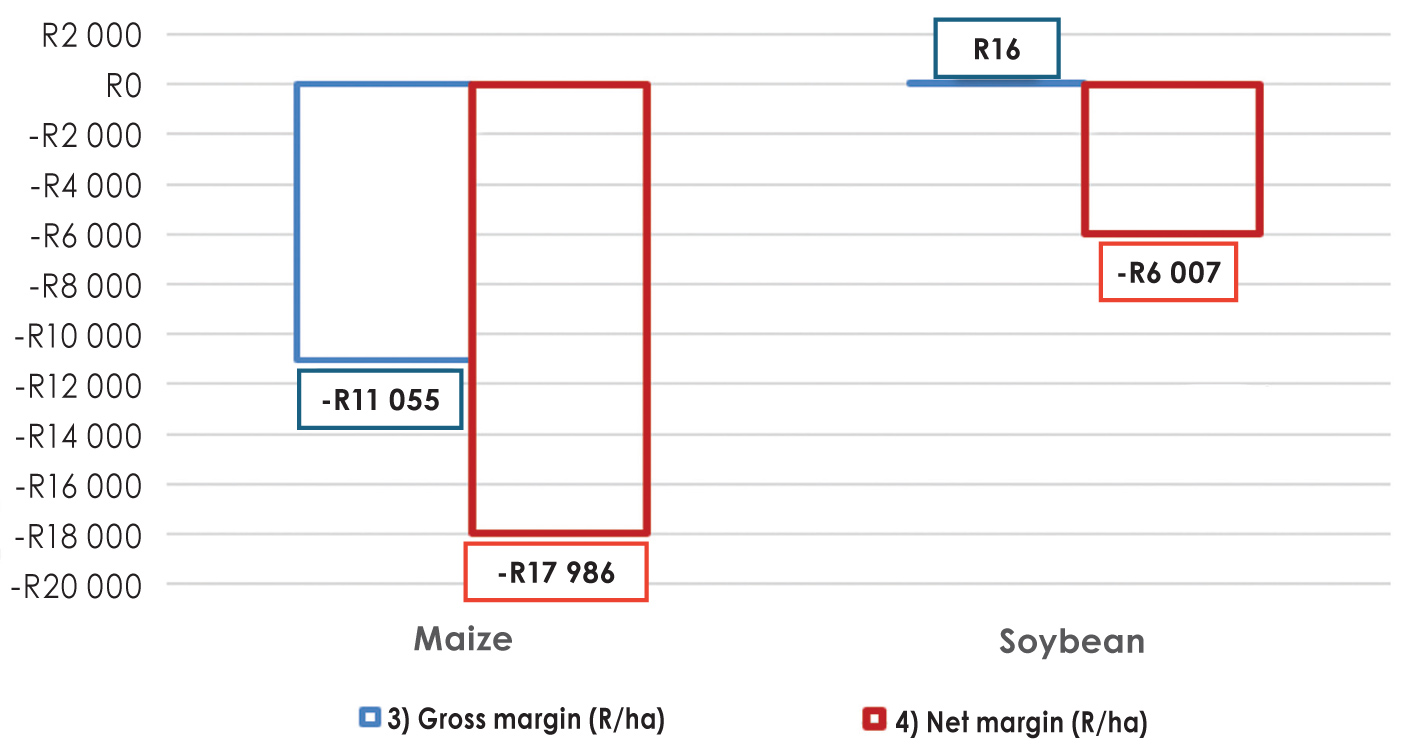
In contrast, irrigated soybean production requires a considerably lower investment with variable costs reaching R26 961/ha, recording an almost break-even gross margin. Lower fertiliser requirements and reduced irrigation costs improve its financial performance relative to maize, although fixed costs continue to result in a negative net margin (see Graph 5).
Under irrigation, high production potential is outweighed by exceptionally high operating costs, making cost control critical to financial success.
Conclusion
Generally, the profitability of grain production remains under pressure compared to the 2025/2026 production season. However, the profitability of any crop depends on the interaction between three key factors: the price received for the commodity, the yield achieved per hectare, and the cost of producing it. A change in any one of these factors, whether through higher input costs, lower yields due to adverse weather conditions, or fluctuations in market prices, can have a significant impact on financial returns.
These budgets should therefore be viewed as planning tools rather than predictions of profitability. Every farming business is unique, and actual production costs will depend on production practices, realised yields, marketing decisions, and prevailing market conditions throughout the season. Careful budgeting, cost control, and realistic yield expectations will remain essential to support informed planting decisions and improve the resilience of farming businesses during the 2026/2027 production season.
Sincere appreciation to the Maize Trust for funding this project and to the input companies and producers who provide their inputs to assist with the compilation of these budgets. For any enquiries, please send an email to economist@grainsa.co.za.
Disclaimer: The information herein has been obtained from various sources, the accuracy and/or completeness of which Grain SA does not guarantee and for which Grain SA accepts no liability. Any prices or levels contained herein are preliminary and indicative only and do not represent bids or offers. These indications are provided solely for your information and consideration.