


general manager,
SAGL NPC
Maize industry members, represented on the trade group of the Maize Forum steering committee, have since 2019 discussed possible recommendations to improve the maize grading regulations. The discussions included questions about the proper definitions for discoloured and water-damaged maize kernels and the effect thereof on the nutritional value and milling quality of affected maize.
The Southern African Grain Laboratory (SAGL) was requested to conduct a study to provide the necessary information needed for the industry to base informed decisions on. The funding for the investigation was provided by the Maize Trust.
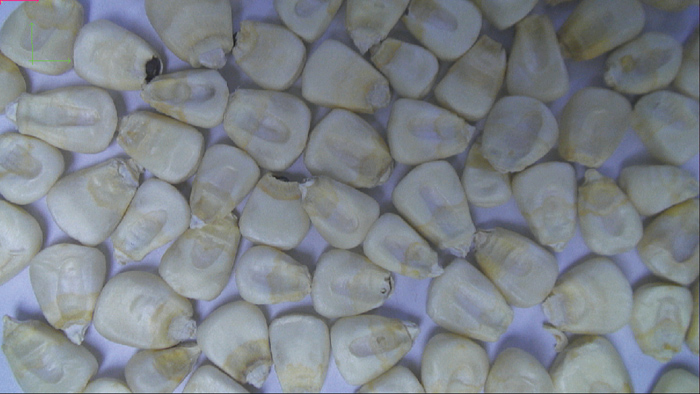
Material had to be sourced directly from specific areas where these defects were detected. The experimental design required maize kernels with either water damage or discolouration and not a combination of the two defects or in combination with any other defect such as frost damage. Sufficient water-damaged and discoloured white maize were sourced, but no yellow maize could be sourced. The decision was taken to continue with the investigation on the white maize.
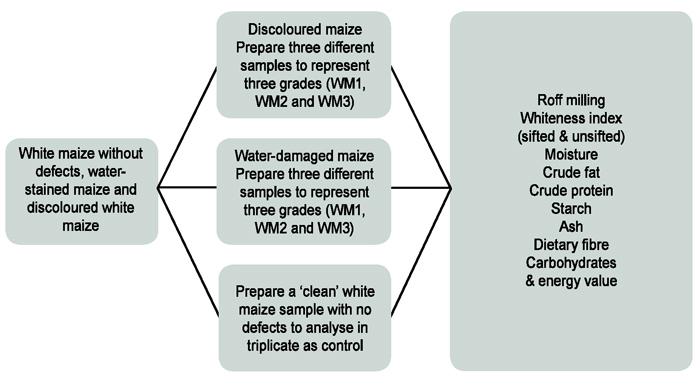
 The samples for analysis were prepared as detailed in Figure 1. White maize was cleaned by removing all the defective kernels. Two sets of maize samples were prepared by adding known quantities of either water-damaged kernels or discoloured white maize kernels (6%, 12% and 29% deviations added) to the ‘clean’ white maize. These percentages represented the three white maize grades with regards to defective maize kernels which include discoloured maize kernels. Three replicates of each sample were milled on the Roff mill and analysed individually.
Milling of maize on Roff maize mill
The Roff 150 series maize mill was used to mill a 500 g representative sample. Every mill has three separations, namely chop, grits and maize meal.
The grits from break 1 are transferred to the break 2 rolls and the grits from break 2 are transferred to break 3 rolls. The following fractions are weighed and determined as percentages:
- Break 1 meal
- Break 2 meal
- Break 3 meal
- Break 3 grits
Chop from break 1, 2 and 3 is combined for the determination of the percentage chop. Break 3 grits represent the percentage grits. The total meal extraction is determined as the sum of the meal from break 1, 2 and 3 as well as the percentage grits.
Whiteness index (sifted & unsifted)
Whiteness index (WI) of white maize meal is determined with the HunterLab Colorflex 45°/0° instrument. Whiteness is associated with a region or volume in colour space in which objects are recognised as white.
The degree of whiteness is measured by the degree of departure of the object from a perfect white. The higher the whiteness index value, the whiter the sample.
WI is done on unsifted and sifted maize meal obtained from break 2 and 3 of the Roff mill. The sifted samples are obtained by sieving the unsifted samples through a 300 µm sieve. The fractions on top and below the sieve are then combined to result in sifted samples that contain 87% of maize meal >300 µm and 13% of maize meal <300 µm.
Moisture on milled maize
Milled maize samples from the Roff maize mill are dried in an oven for one hour at 130°C to determine the percentage moisture.
Crude fat – petroleum ether extraction
The percentage fat is determined by extracting the fat from the maize samples milled on the Roff maize mill using Soxhlet extraction and petroleum ether as the extraction solvent.
Crude protein – Dumas method
The crude protein in the maize meal samples is determined using the combustion method. Nitrogen, freed by pyrolysis and subsequent combustion at high temperature in pure oxygen, is quantified by thermal conductivity detection. The percentage nitrogen is converted to percentage protein by multiplying with the factor 6,25.
Starch
Maize meal samples are analysed to determine the starch content, using the hydrochloric acid dissolution method and a polarimeter. The starch granules are converted to sugars by boiling in dilute hydrochloric acid. The sugars in the filtrate are determined by measuring the angle of polarisation or optical rotation of the filtrate with a polarimeter. The acid also helps to break down the endosperm tissue, ensuring complete release of the starch granules from the protein matrix.
Ash
The ash content of the maize meal samples is analysed by determining the quantity of mineral matter that remained as incombustible residue after incineration of the sample in a muffle furnace.
Dietary fibre – enzymatic-gravimetric method
The total dietary fibre content of the maize meal samples is determined using a combination of enzymatic and gravimetric methods.
Calculated carbohydrates and energy value
For calculating the carbohydrates and energy value, the ‘as is’ values of the individual chemical results are used.
Results and discussion for water-damaged maize kernels
Roff milling
The difference between the highest and lowest percentage extraction total meal of the twelve samples was 2,5%, which is less than the variation in the extraction range for any of the three grades of white maize (WM1, WM2 and WM3) reported on the crop quality samples over the last five seasons.
WI
WI results of the samples showed that the unsifted WI of the crop quality white maize of the 2018/2019 season ranged between 10,0 and 40,1 and averaged 30,2 for the three grades of white maize. The variation observed on the unsifted WI of the twelve samples measured as part of the project is 14% of the variation observed on the unsifted WI of the WM1, WM2 and WM3 maize crop samples of the 2018/2019 season and smaller than the variation observed on any of these three grades per season for the last five seasons.
The sifted WI of the twelve individual samples ranged from 26,5 (clean maize) to 29,4 (WM3). The sifted WI of the crop quality white maize of the 2018/2019 season ranged between -0,3 and 36,6 and averaged 20,4 for the three grades of white maize. The variation observed on the sifted WI of the twelve samples is 8% of the variation observed on the sifted WI of the WM1, WM2 and WM3 maize crop samples of the 2018/2019 season and smaller than the variation observed on any of these three grades per season for the last five seasons.
Nutritional composition
- Crude fat percentage (dry base [db]) – When comparing the results of the ‘clean’ and three different WM grades (0%, 6%, 12%, 29% added) the percentage crude fat measured for WM1 and WM2 falls within the same range as the triplicate analyses of the ‘clean’ maize (between 1,8% and 1,9%), with the WM3 slightly lower at 1,7% crude fat (db).
- Crude protein percentage (db) – The average protein results of the three replicates for the four different samples were as follows: ‘clean maize’ (0%) 7,51%; WM1 (6%) 7,40%; WM2 (12%) 7,37% and WM3 (29%) 7,26%. The variation between the clean maize and the three different grades is only 0,25%.
- Starch percentage (db) – The highest starch content was measured in the WM3 samples (85,4% to 86,9%) averaging 86,1%, while the ‘clean maize’ and the other two grades ranged between 82,9% and 84,9%. The variation between the three replicates of each of the four samples ranged between 0,5% and 2%.
- Ash percentage (db) – The measurements of all the samples, except one replicate of WM3, varied between 0,58% and 0,65%, indicating no significant difference between the samples with varying amounts of water-damaged kernels added.
- Dietary fibre percentage (db) – The range of the measurements on the triplicate ‘clean maize’ samples was between 2,5% and 3,1% and the triplicate analyses on the WM1, WM2 and WM3 ranged between 2,4% and 3,2%, which suggest no difference when the water-damaged maize was added to clean maize.
- Energy value (calculated) (kJ/100 g) and carbohydrates (by difference – g/100 g) – The average energy results of the three replicates for the four different samples were as follows: ‘clean maize’ (0%) 1 345 kJ/100 g; WM1 (6%) 1 334 kJ/100 g; WM2 (12%) 1 339 kJ/100 g and WM3 (29%) 1 347 kJ/100 g. The variation between the clean maize and the three different grades is only 13 kJ/100 g. The average carbohydrate results of the three replicates for the four different samples were as follows: ‘clean maize’ (0%) 73,7 g/100 g; WM1 (6%) 73,3 g/100 g; WM2 (12%) 73,4 g/100 gand WM3 (29%) 74,4 g/100 g. The variation between the clean maize and the three different grades is only 1,1 g/100 g. Both the energy value and the carbohydrates do not show any significant differences in the values calculated on the ‘clean maize’ as well as the three grades of white maize.
Results and discussion of discoloured maize kernels
Roff milling
The difference between the highest and lowest percentage extraction total meal of the twelve samples analysed as part of the project was 2,2%. This 2,2% difference is less than the variation in the extraction range for any of the three grades of white maize (WM1, WM2 and WM3) reported on the crop quality samples over the last five seasons.
WI
Unsifted WI of the twelve individual samples ranged from 34,1 (clean maize) to 37,5 (WM3). The unsifted WI of the crop quality white maize of the 2018/2019 season ranged between 10,0 and 40,1 and averaged 30,2 for the three grades of white maize.
The variation observed on these twelve samples measured as part of the project is 11% of the variation observed on the WM1, WM2 and WM3 maize crop samples of the 2018/2019 season and also smaller than the variation observed on any of these three grades per season for the last five seasons.
Sifted WI of the twelve individual samples ranged from 24,1 (clean maize) to 29,2 (WM3). The sifted WI of the crop quality white maize of the 2018/2019 season ranged between -0,3 and 36,6 and averaged 20,4 for the three grades of white maize.
The variation observed on these twelve samples measured as part of the project is 14% of the variation observed on the WM1, WM2 and WM3 maize crop samples of the 2018/2019 season and also smaller than the variation observed on any of these three grades per season for the last five seasons.
Nutritional composition
- Crude fat percentage (db) – When comparing the results of the ‘clean’ and three different WM grades (0%, 6%, 12%, 29% added) the percentage crude fat measured for WM1, WM2 and WM3 ranged between 1,7 and 1,9%, with the ‘clean maize’ sample at 2% crude fat (db).
- Crude protein percentage (db) – The average protein results of the three replicates for the four different samples were as follows: ‘clean maize’ (0%) 7,51%; WM1 (6%) and WM2 (12%) both 7,35% and WM3 (29%) 7,19%. The variation between the clean maize and the three different grades is only 0,32%.
- Starch percentage (db) – The highest starch content was again measured in the WM3 samples, averaging 85,4% and ranging between 84,6% and 86%. The clean maize, WM1 and WM2 samples ranged between 83,6% and 86%. The variation between the three replicates of each of the four samples ranged between 0,3% and 2,3%.
- Ash percentage (db) – The results for the ash analyses for WM1, WM2 and WM3 were between 0,56% and 0,63% and the ‘clean maize’ sample between 0,68% and 0,71%.
- Dietary fibre percentage (db) – The range of the measurements on the triplicate ‘clean maize’ samples was between 2,1% and 2,5% and the triplicate analyses on the WM1, WM2 and WM3 ranged between 2,6% and 3,3%, which suggest no difference when the discoloured maize is added to clean maize.
- Energy value (calculated) (kJ/100 g) and carbohydrates (by difference – g/100 g) – The average energy results of the three replicates for the four different samples were as follows: ‘clean maize’ (0%) 1 351 kJ/100 g; WM1 (6%) 1 340 kJ/100 g; WM2 (12%) 1 341 kJ/100 g and WM3 (29%) 1 333 kJ/100 g. The variation between the clean maize and the three different grades is only 18 kJ/100 g. The average carbohydrate results of the three replicates for the four different samples were as follows: ‘clean maize’ (0%) 73,8 g/100 g; WM1 (6%) 73,6 g/100 g; WM2 (12%) 73,7 g/100 gand WM3 (29%) 73,5 g/100 g. The variation between the clean maize and the three different grades is only 0,3 g/100 g. Both the energy value and the carbohydrates do not show any significant differences between the values calculated on the ‘clean maize’ and the three grades of white maize.
Conclusion
After evaluation of the outcomes of the investigation on white maize, the industry representatives agreed that the results of the investigation are conclusive to the extent that the investigation on yellow maize is unnecessary.
References
- Regulations relating to the grading, packaging, and marking of maize intended for sale in the Republic of South Africa, No R473, Government Gazette, 8 May 2009.
- SAGL Report: Investigation into the effect of discolouration and water damaged white maize kernels on nutritional value and milling yield.
- SAGL Reports: South African Maize Crop Quality Reports. www.sagl.co.za.


