


Since false armyworm was never a serious pest in South Africa, moth flight activity was not monitored prior to the first outbreak in 2010. Therefore, it was decided to look at the rainfall pattern for the Hartswater and Douglas regions where this outbreak occurred and compare it with data of 2009 and 2011.
During the previous season we reported on the phenomenon that female moths are especially attracted towards the smell of fermenting rotten grass, which normally occurs on the edges of irrigated fields. They then deposit their eggs in this environment where young larvae will feed on both grass and grains. Such congregations may play an important part in an outbreak situation. For example, if an irrigated field is the only place where fermenting rotten grass is present and numerous moths are flying, the female moths will be attracted towards this particular field and many eggs would be deposited there. However, if enough rain occurs in spring before moth flights, rotting grass would occur over an extended area and eggs would be widely distributed, thereby relieving the pressure on irrigated fields.
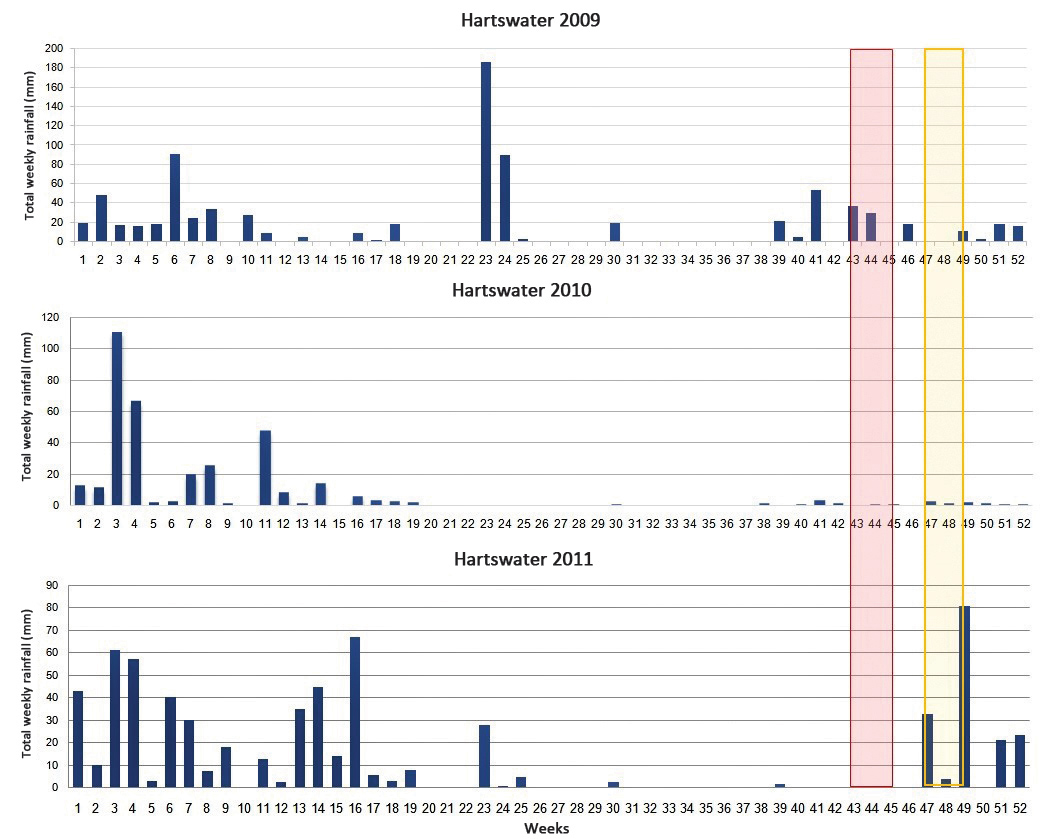
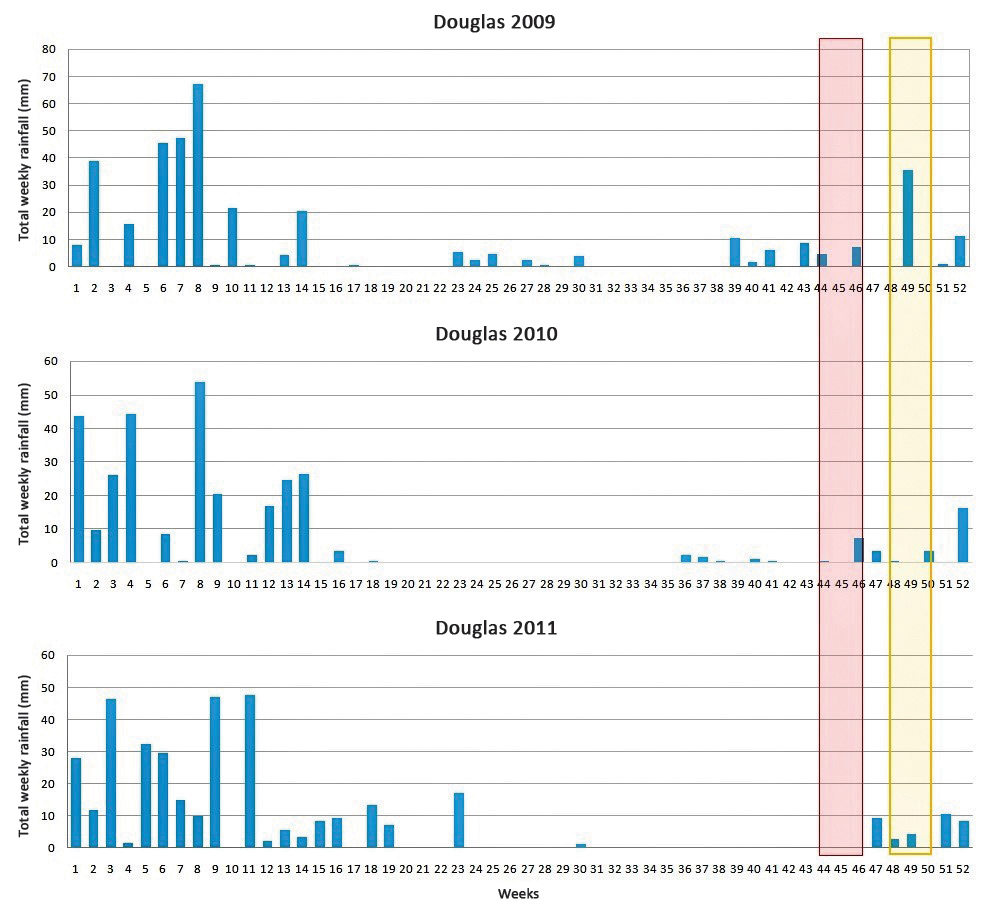
Rainfall in Hartswater and Douglas areas
Rain fell in the Hartswater area throughout the small-grain growing season during 2009, while in 2010 only 27 mm were measured between week 15 and week 52 (Graph 1 to Graph 3). This means less than 1 mm rain per week from week 15 onwards compared to ± 14 mm/week and 8 mm/week during the same time in 2009 and 2011, respectively.
In the Douglas region the same rainfall pattern occurred during these three years, though overall lower (Graph 4 to Graph 6). In 2010 only 43 mm fell between week 15 and 52. This is just more than 1 mm/week, which is lower than the 2,8 mm/week and 2,4 mm/week for 2009 and 2011, respectively. From both the graphs it is clear that during 2010 almost no rain occurred in the six-week period before harvest and therefore the irrigated fields were the only environments where rotten grass could occur. The same happened during 2011 in both regions, but producers were on the alert then and sprayed preventatively. Thus, not only the moth numbers need to be monitored, but also the rain pattern.
Current season
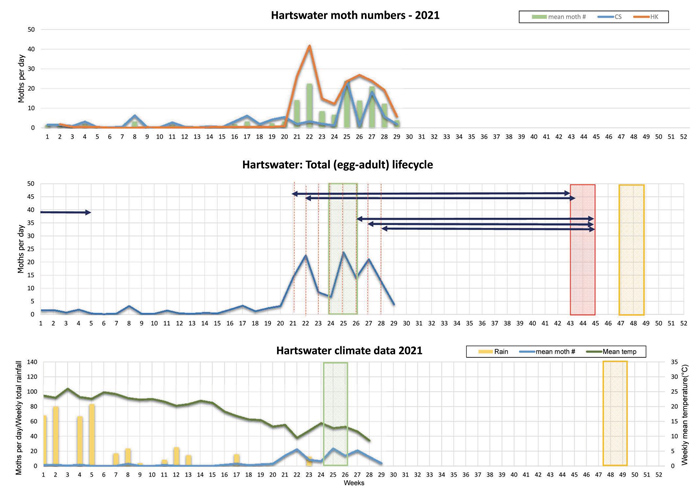
From January 2021 limited moth activity was noted in most of the barley-producing areas. However, a strong moth flight peak developed in the Hartswater area between week 21 and 24 (Graph 7 to Graph 9). The next generation of moths from this peak is expected to start flying during the critical period before harvesting – and depending on the number of moths from this peak, a small outbreak may occur. It is, however, dependent also on the amount of rain that will occur before this critical period and whether the moth eggs will be spread out or concentrated on irrigated fields.
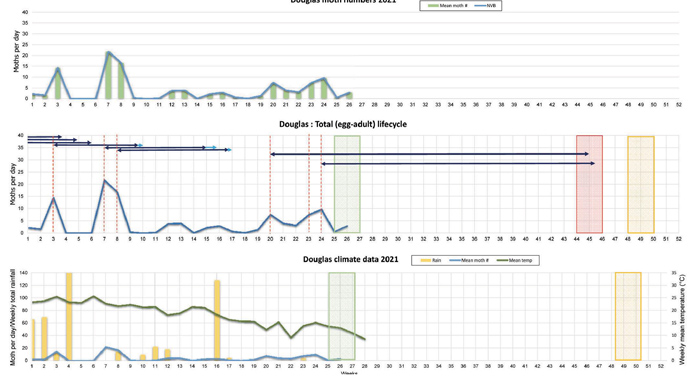
Much lower moth numbers are currently present in the Douglas area (Graph 10 to Graph 12). Small peaks at weeks 20 and 23 will result in new moth generations flying during the critical period. The seriousness of these peaks should be followed together with the rainfall before the critical period.
What can be concluded from these results is that the forecasting model can provide an early indication of what could happen, but it is only a forecasting. Climatic conditions should be taken into account together with the forecasting before clear-cut decisions can be made during the critical period. The model is therefore a useful tool that producers could use in their pest control decision-making.![]()
For more information about the model, contact the author at prinsloogj@arc.agric.za or 058 307 3435.
This research was made possible with financial support from AB InBev.


