

manager: Data Science, BFAP
 Dr Dirk Strydom,
manager: Grain Economy and Marketing, Grain SA
On-farm data are a very important part of agriculture in this day and age. However, together with the need for data, there is always the large challenge of reducing costs.
Two of the largest cost components in the production system are the expenditure on seed and fertiliser. Based on research from the International Benchmark Network, South Africa has the third most expensive fertiliser in the world.
In order to manage and research these cost structures, a research consortium was formed between the University of Illinois (UI), the Bureau for Food and Agricultural Policy (BFAP), the Protein Research Foundation (PRF), the University of Pretoria and Grain SA. Data Intensive Farm Management (DIFM) has excellent potential in increasing farm profitability by spatially exploring the agronomic and economic response of altering seed and fertiliser rates within a field. It makes use of a producer’s existing precision agriculture equipment (GPS guidance; variable seed and fertiliser applicators; yield monitors) to conduct experiments on commercially farmed fields, and in so doing determine optimal rates for different parts of the field. The trial set-up and interpretation aim to also inform maximum profit and not just maximum yield.
The project was successfully implemented in the summer planting season of 2019, following a visit of Robert (Bob) Redunker of UI to South Africa in October as well as visits by the research teams to the farm Wonderfontein in Mpumalanga and a farm near Hennenman in the Free State. For this article the trial performed on the Hennenman farm will be discussed.
Hennenman
Background information
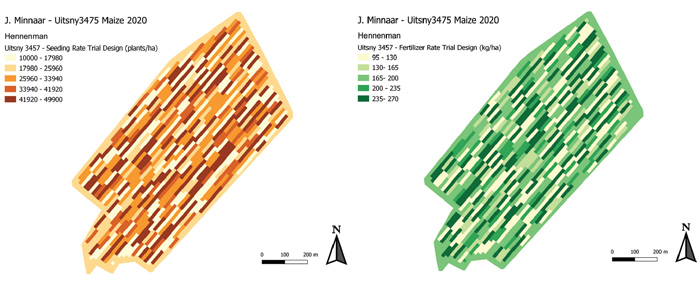
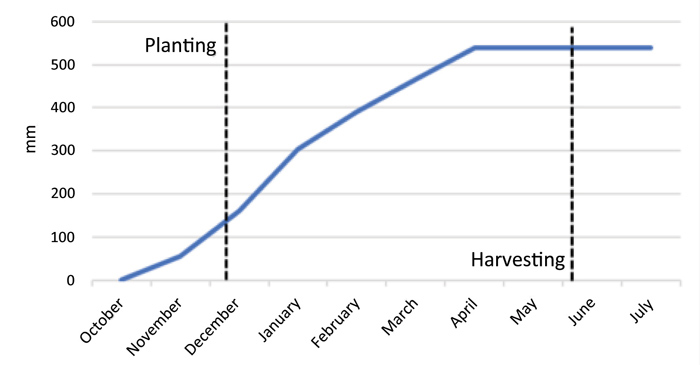
The planter used for this trial was a John Deere Equalizer with 16 rows (3 ft) and a total width of 14,64 m, using a John Deere Seedstar 2 and Greenstar rate controller. Seeding rates of 18 000 seeds/ha are typically used, but in the past good results have been achieved with rates of up to 40 000 seeds/ha – so trials were done on rates between 10 000 and 50 000 seeds/ha to be tested. Usually 200 kg/ha of 15:10:6 (31) (+8% S) is applied with planting, with an additional 90 kg urea/ha (46% N) applied before planting and another 90 kg urea/ha as a top dressing. It was decided that the DIFM trial would test 90 kg to 270 kg urea/ha applications with planting (the pre-planting preparations were already completed on 17 October when the producer was visited).
Following planting, it was reported by the producer that the design worked very well, with the exception of transitions between large plant population variations (for example 10 000 to >50 000) during which the planter struggled, suggesting that in such cases 15 000 seeds/ha may have been planted instead.
Trial design and execution
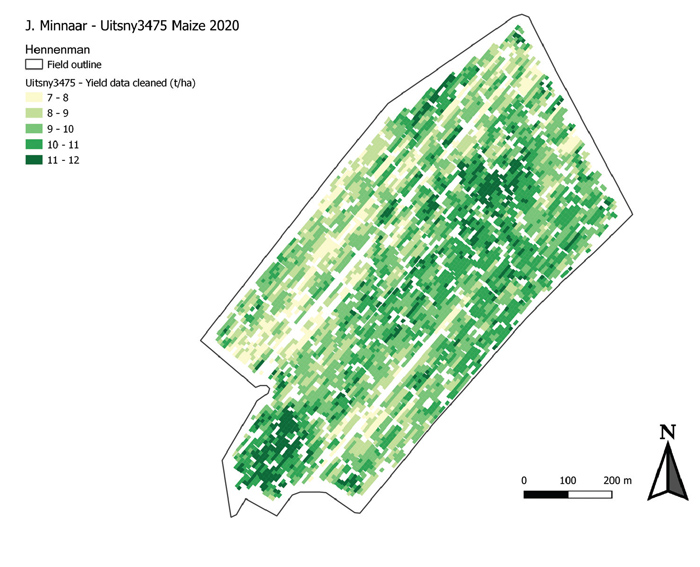
From the comparison between Figure 1 and Figure 2, it is clear that the trial was largely executed successfully. The trial field reportedly also received timely and sufficient rain, with a shower on Thursday 5 December 2020, four days prior to planting the trial on 9 December.
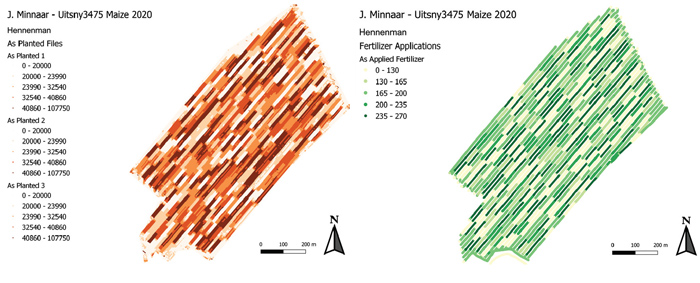
While cleaning the received harvested yield data, two rows recorded noticeably lower yields. The producer confirmed that in these two rows, the pre-planting urea probably ‘ran out’ during the field preparation. While these rows did receive the ‘as planted variable fertiliser rate’, they had notably lower yields compared to the rest of the field. These two rows as well as the transition zones were removed from the yield data while cleaning it through the use of various mathematical and machine-learning algorithms. The cleaned data (see Figure 3) resulted in 2 400 ‘trial plots’ or units where consistent yields and treatments (seed rate and urea application) were observed.
Analysis and conclusion based on the data
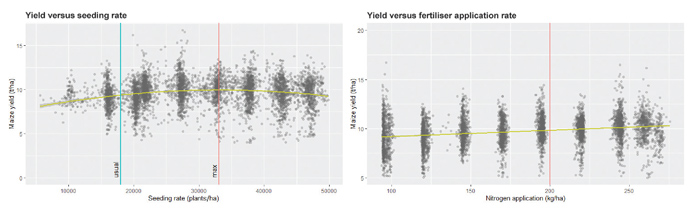
Figure 4 shows the yield data compared with as-planted seeding rate and as-applied fertiliser application rate respectively. The producer’s usual rate is indicated. Yield is maximised with a seeding rate of 33 070 plants/ha with an average yield of 10 t/ha. This was in line with the producer’s expectation. For the urea application, however, a straight line best fits the data and therefore cannot be maximised. The average yield increases consistently with higher fertiliser application, with no turning point observed within the range of fertiliser rates considered.
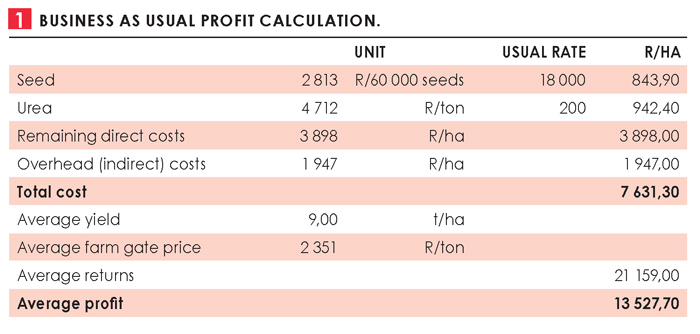
The producer provided the research team with the direct and indirect costs involved in planting the trial. Table 1 presents the ‘business as usual’ costs, returns and profit per hectare for the trial location (based on an average farm gate price, also provided by the producer).
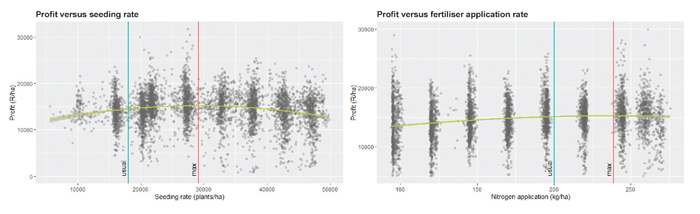
 In Figure 5, the profit per hectare was calculated for all the trial plots and related to combinations of seeding rate and fertiliser application. For the seeding rate, the average profit is maximised at 28 147 plants/ha with an average profit estimation of just under R15 000/ha. For the fertiliser application, the average profit is maximised at 239 kg/ha with an estimated profit of just above R15 000/ha.
In the future, efficiency will be the most important factor to ensure sustainability. Producers in South Africa know how to increase yields and how to obtain the largest yield from limited resources. However, at the end of the day, sustainability is based on the profitability of a farm, thus it is important to maximise profits. In the analysis it is clear that the largest yield is not always the most profitable.
Although this is only one trial, the new methodology of doing trials with precision technology yields a vast number of repetitions of the management treatments considered (compared to traditional strip trial methodology) and therefore enables faster and more accurate decision making. With more of these trials, local trends will be discovered in order to assist producers who do not have variable rate applicators. In the coming season more trials will be done to obtain more data under different climatic conditions.


