


MSc Agric researcher, Plant Pathology, Univer-sity of the Free State

Dr Lisa Rothmann, senior lecturer, Plant Pathology, University of the Free State
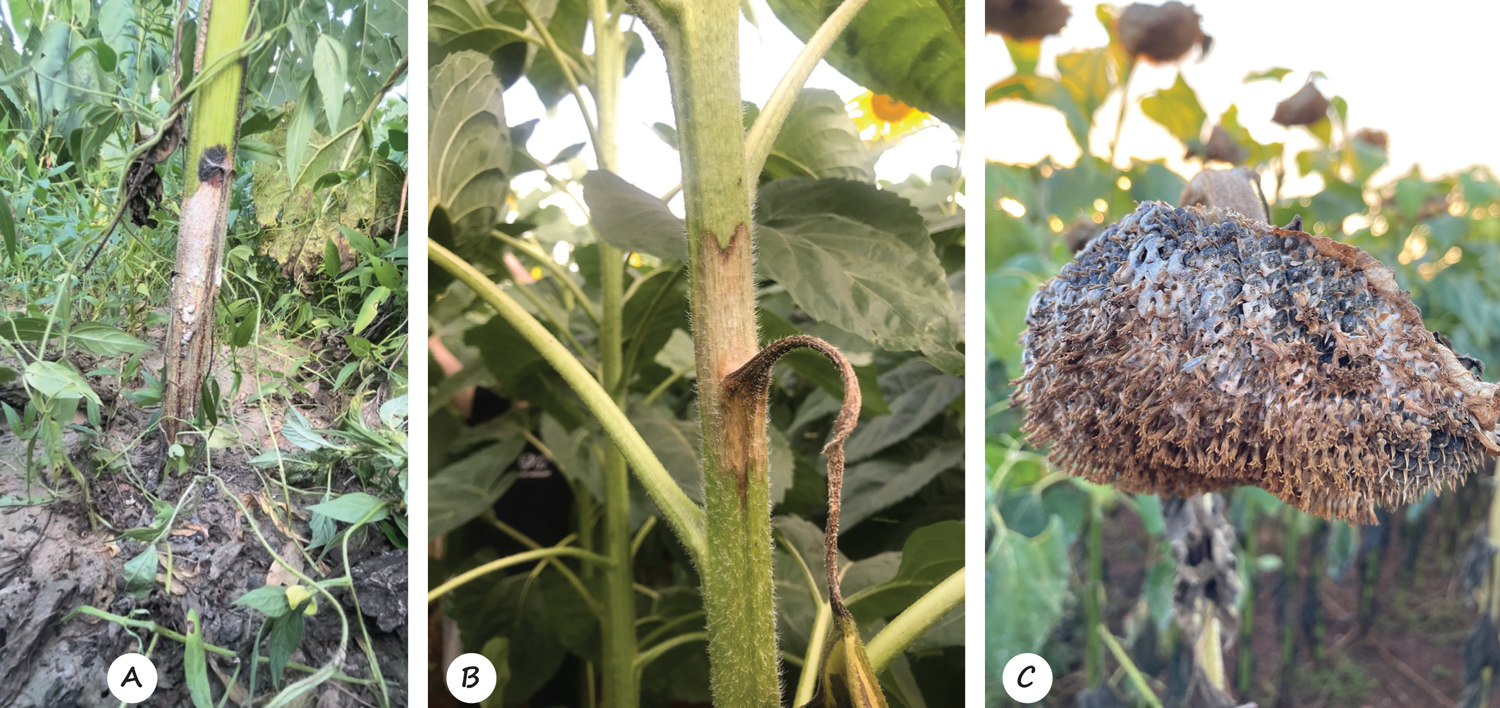
Three distinct diseases in sunflower are caused by Sclerotinia sclerotiorum, depending on the behaviour of the pathogen. Basal rot (Figure 1A) is most often initiated when sclerotia germinate directly to produce mycelium, although it may also result from ascospore infection.
In contrast, stem rot (Figure 1B) and head rot (SHR) (Figure 1C) develop when ascospores are released from apothecia, infecting the plant. During the recently concluded season, sunflower production experienced significant epidemics of SHR across key production regions. To assess the intensity of SHR, researchers use two key measurements: incidence, indicating the number of plants showing symptoms, and severity, indicating the portion of a sunflower head exhibiting symptoms (Bock et al., 2022; Madden & Hughes, 1995).
While measuring disease incidence is useful as it is quicker to assess in the field, evaluating disease severity provides a more comprehensive understanding of epidemic dynamics and supports better research and management decisions. However, measuring severity presents challenges, as it relies on subjective visual estimates, where individuals must judge what percentage of the sunflower head is diseased compared to the total head area, often relying on rough estimation and experience. Although, there are visual guides known as standard area diagrams (SADs) which help researchers evaluate disease severity with greater precision, accuracy and consistency differ between raters. A databank of all existing SADs has been compiled into a web application created by Prof Emerson M. Del Ponte and Dr Ignácio Cazón. The databank is known as the SADbank (https://edelponte.shinyapps.io/sadbank/) and houses 189 SADs for 139 pathogens on 73 different hosts. However, none existed for SHR caused by S. sclerotiorum.
To address this, Kwanele Sabela, an MSc Agric researcher in the McLab Epidemiology & Field Pathology group at the University of the Free State, has developed and validated an evaluation tool known as a standard area diagram (SAD). In this article, we briefly explore how SADs are developed and the mathematics that demonstrate how the SAD improves precision, accuracy, and agreement in SHR assessments.
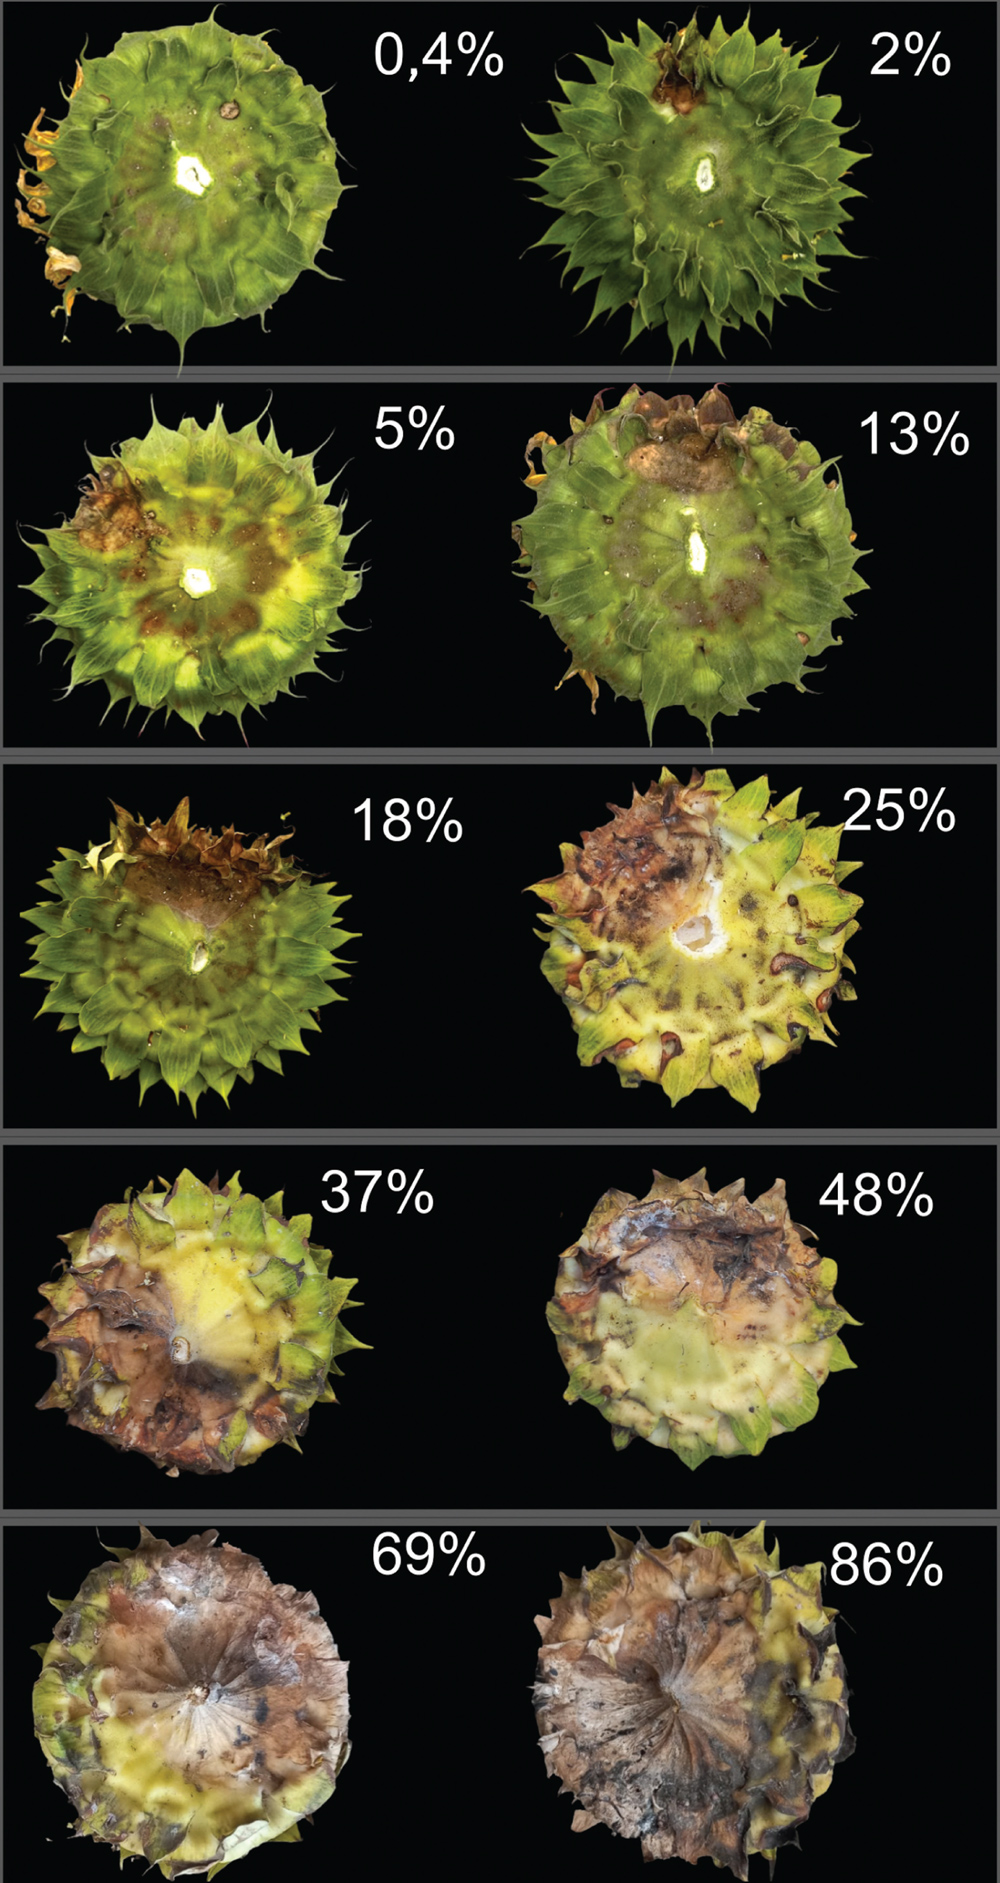
Using digital tools like ImageJ, a computer-based image analysis tool, the amount of healthy tissue can be measured in contrast to the total sunflower head tissue. A set of photos clearly representing the range of disease symptoms most commonly found in the field is selected to create a pictorial diagram (Figure 2). To determine how well the SAD works in practice, 16 people estimated disease severity without the SAD, subjectively, and then again using the SAD for comparison. Note the difference between a measurement, which provides an exact value using tools or equipment, and an estimate, which relies on visual judgement and is subjective by nature.
When it is evaluated how well the SAD performs, three important concepts guide the quality of assessments: accuracy, precision, and agreement. Accuracy refers to how close an estimate is to the true or actual value. For example, if the actual infected area on a sunflower head is 40%, an accurate estimate would be very close to that number. In contrast, precision describes how consistently repeated estimates cluster together, regardless of whether they are correct. For example, where multiple raters give similar estimates, they are precise, even if they are all slightly off from the true value.
Agreement refers to how closely two or more raters align in their evaluations to one another. High agreement means that different people produce similar results when assessing the same thing. This is important because if these three aspects can be improved, subjective estimates can be brought closer to functioning like measurements. The statistical tool used is Lin’s concordance correlation coefficient (ρc). This coefficient combines two pieces: Pearson’s correlation coefficient (r), which measures precision, and a bias correction factor (Cb), which accounts for accuracy, adjusting for any consistent over- or underestimation. Together, ρc gives a single value that reflects both how closely and how correctly raters are estimating disease severity, offering a statistical measure of precision, accuracy, and agreement.
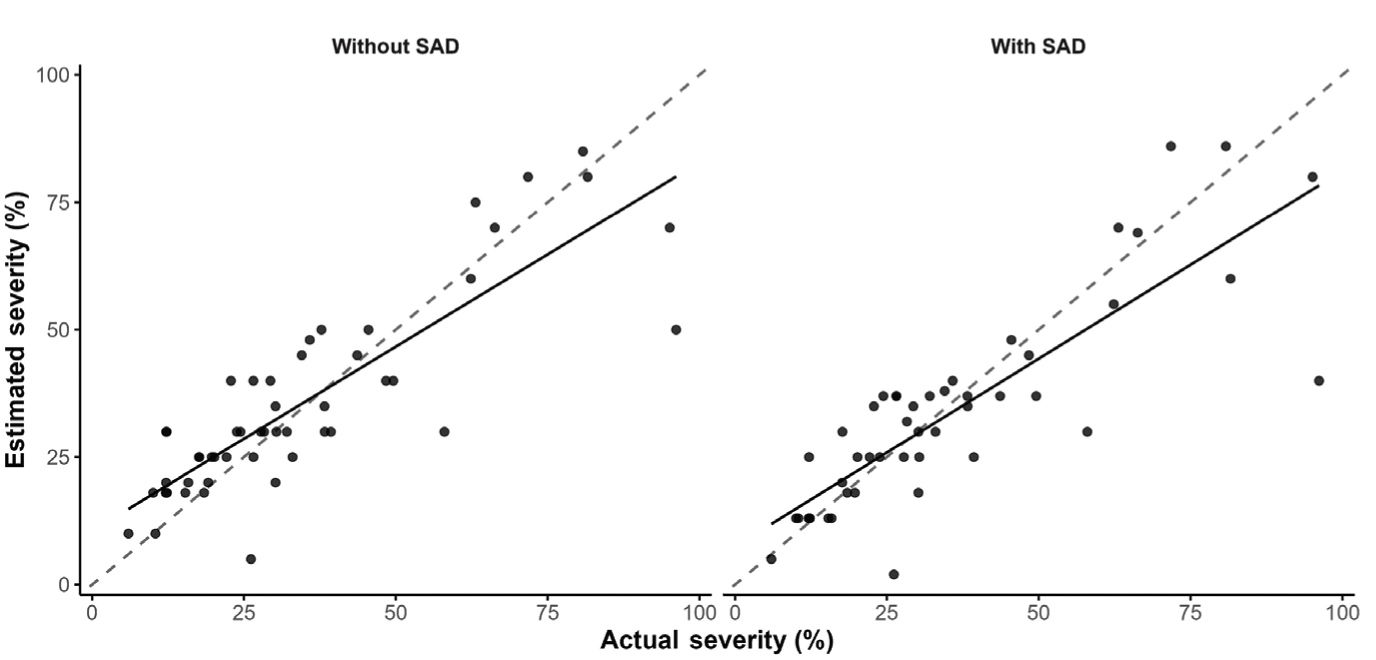
The SAD was used in the field to test its practicality, where five raters were estimating SHR severity without and with the use of the SAD.
In Figure 3, the rater struggled to estimate SHR disease severity, frequently underestimating or overestimating the actual values (see the solid line crossing over the dashed line), meaning there was little precision or accuracy. While the use of the SAD improved the consistency of their scores, indicating better precision, a single use of the SAD did not improve their accuracy. Raters like this may benefit from targeted training sessions that focus on recognising disease symptoms more accurately and interpreting visual aids like SAD more effectively.
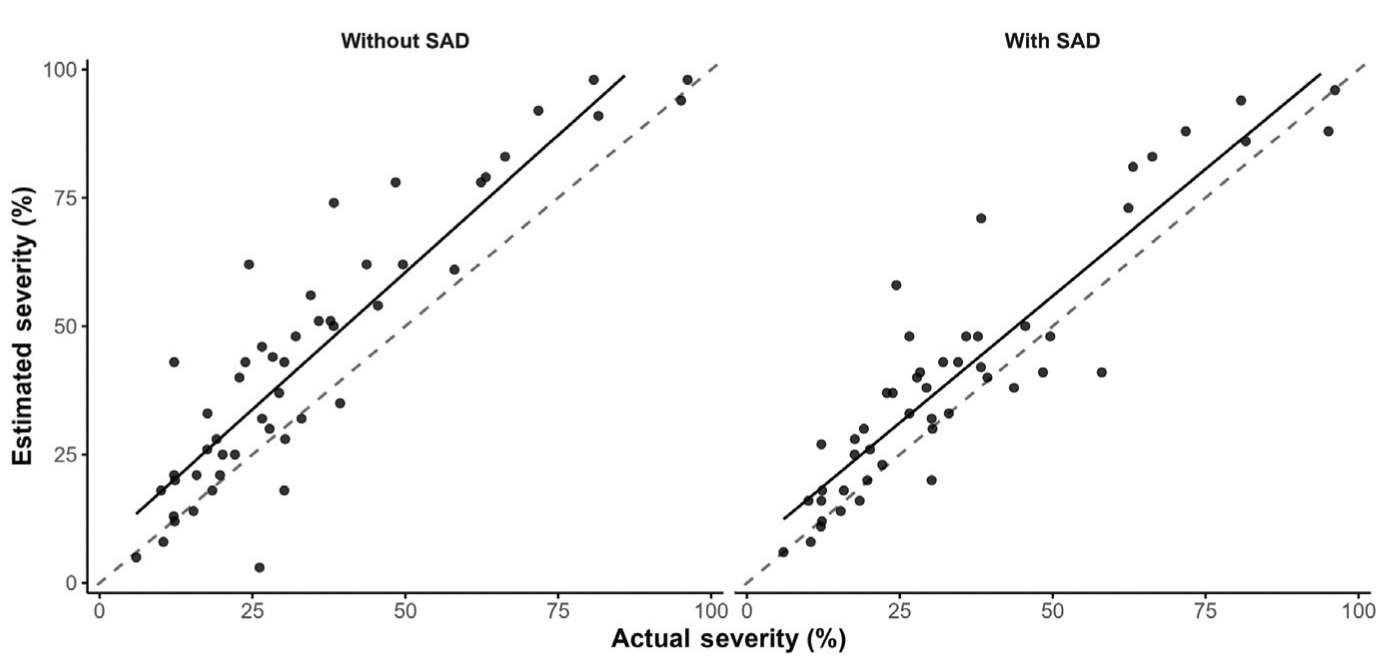
In Figure 4, the rater consistently overestimated the severity (see the solid line above the dashed line) of SHR during visual scoring, showing poor accuracy but relatively good precision. After introducing the SAD, their estimates shifted closer to the actual severity, reducing the extent of overestimation and improving overall accuracy. Precision also increased further, showing that the rater applied the SAD consistently and effectively.
In validating the SAD with 16 raters, the usage of the SAD improved both the accuracy and precision of disease severity estimates for SHR. Overall, there was consistency between raters when rating the same sample after using the SAD. However, training is critical: this is training on how to recognise certain symptoms, disease estimation, and using the SAD. All these can be done by utilising training tools that are available online, such as Trainer2 web application (https://delponte.shinyapps.io/traineR2/). Investing time in building disease severity rating skills will ultimately benefit both researchers and producers. From here, the plan is to use the SAD in chemical treatment trials, and studies involving severity and yield loss. The data generated could support the development of a decision-support tool that could help producers manage time interventions more effectively.


