


Test Laboratory
The Nebraska Tractor Test Laboratory (NTTL) came into existence in 1920 as the result of a law passed in the US state of Nebraska in 1919 to protect Nebraska producers. At this time, there were over 150 tractor manufacturers and many were not reputable.
Agricultural tractors were first evaluated by early agricultural engineers at the Winnipeg ploughing contests first conducted in 1908 in Canada and these testing procedures were used to determine the first tractor testing requirements. The first tractor tested was a John Deere Waterloo Boy Model N in April of 1920. The original testing requirements consisted of a test of belt horsepower (HP) and drawbar HP. Also, fuel consumption data were included for both tests. It was thought that the NTTL would exist only for a short time to get the disreputable tractor manufacturers out of business and then fade away. However, the reputable manufacturers competed on the results achieved during the NTTL tests, a situation that exists to the present day. As of the present writing, 2 286 tractors have been tested by the NTTL. The results of all published testing can be accessed at no charge at https://tractortestlab.unl.edu/.
Over time, the testing has been modified and adapted to newer tractor technology and to changes in the agricultural machinery industry. The belt power test has been replaced with power take-off (PTO) power testing. As hydraulic power became available, the testing of hydraulic performance was added. Similarly, lifting capacity of three-point hitches has been added and noise testing of tractors is now also included. In 1987, the United States began participating in the Organization for Economic Cooperation and Development (OECD) tractor test codes and schemes. When this change occurred, the NTTL became the official OECD tractor testing station for the US.
A description of the current tractor test
PTO testing (power take-off)
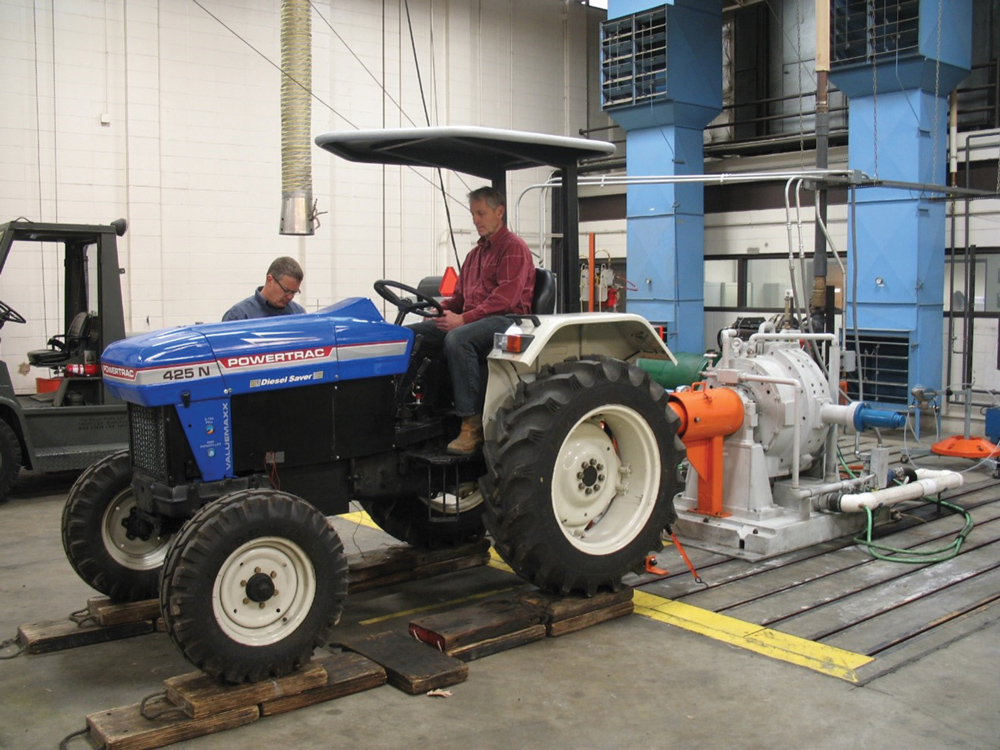
Tractors are connected to a dynamometer for the test. The NTTL uses two dynamometers, a 350 HP dynamometer for type 1 PTO shafts (540 RPM) and a 1 200 HP dynamometer for type 3 PTO shafts (1 000 RPM) and type 4 PTO shafts (1 300 RPM). Type 2 PTO shafts are not generally tested as they are typically only found on European tractors, although those results are comparable to the North American type 3 PTO. A typical section of the PTO report is shown in Table 1.
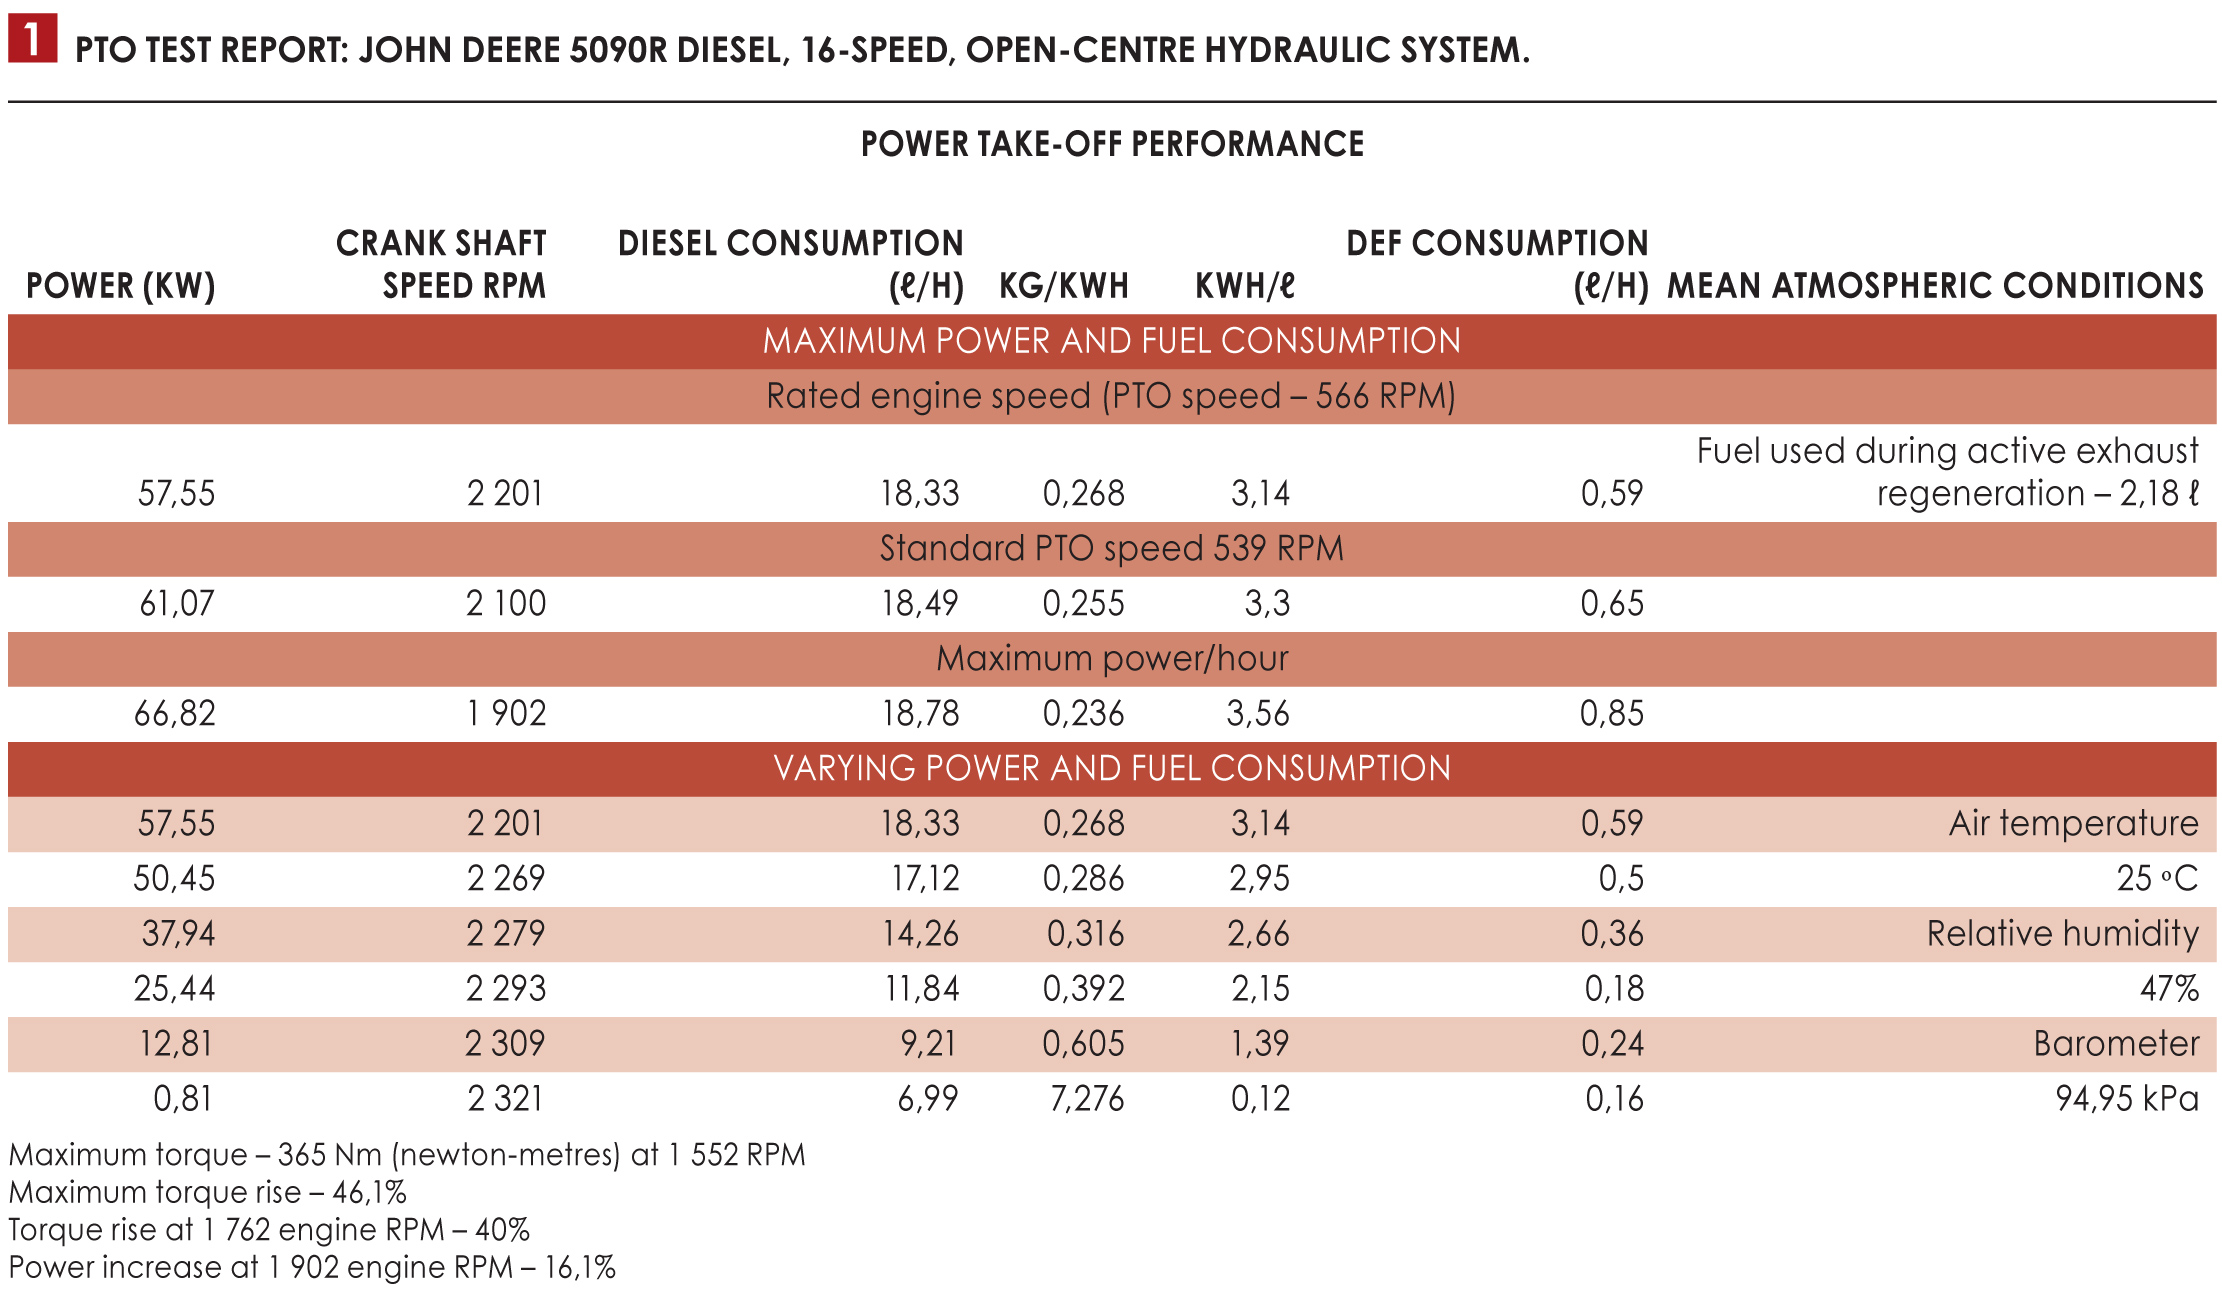 The first three lines of data show the performance of the tractor at rated engine speed, standard PTO speed and maximum power, respectively. These are all 100% loading values. Besides the power achieved, engine speed and fuel consumption in litres/hour are displayed. Also included is a specific fuel consumption in both kilogram per kilowatt hour (kg/kWh) and kilowatt hour per litre (kWh/litre). These two columns present specific fuel consumption in two different ways and are a good way to compare similar sized tractors that may differ in actual power measured. For the first measure (4th data column) the measure is fuel energy over mechanical energy delivered. A lower number represents better fuel efficiency. In the second measure (5th data column) the measure is mechanical energy over fuel energy. In this case, the higher the number, the greater the fuel economy. The final column reports diesel exhaust fluid (DEF) usage. This should not be neglected as DEF is an operating cost.
The lower section of the PTO data provides power and fuel information at partial power points. As it is rare for a tractor in the field to be operating at 100% power, these points are more indicative of actual field conditions. The top line of this section is at rated engine speed at 100% power, the second line is the same as the first with torque reduced to 85% of the value used in the first line. The remaining lines are respectively conducted at 75%, 50%, 25% and 0% of the torque from line 2. Depending on the implement attached, these lines may better represent actual field usage. At the bottom of this section, data about torque rise and power bulge are reported.
Drawbar testing
Table 2 shows the first drawbar results. The column headings are similar to the PTO heading explained above. Torque is replaced by drawbar pull and tire slip is also reported. The first line of this table is the maximum drawbar power achieved, which in this case occurred in gear 8. The drawbar pull is reported as 31,1 kN (kilonewton). The second line reports the same information when the pull is reduced to 75% of the 31,1 kN. The third line reports data when the pull is reduced to 50% of line 1. On all three of the first lines the engine throttle is wide open. The next two lines duplicate 75% of pull and 50% of pull when the tractor is shifted to a higher gear and the engine throttle is reduced to achieve the same travel speed and the comparable 2nd and 3rd lines.
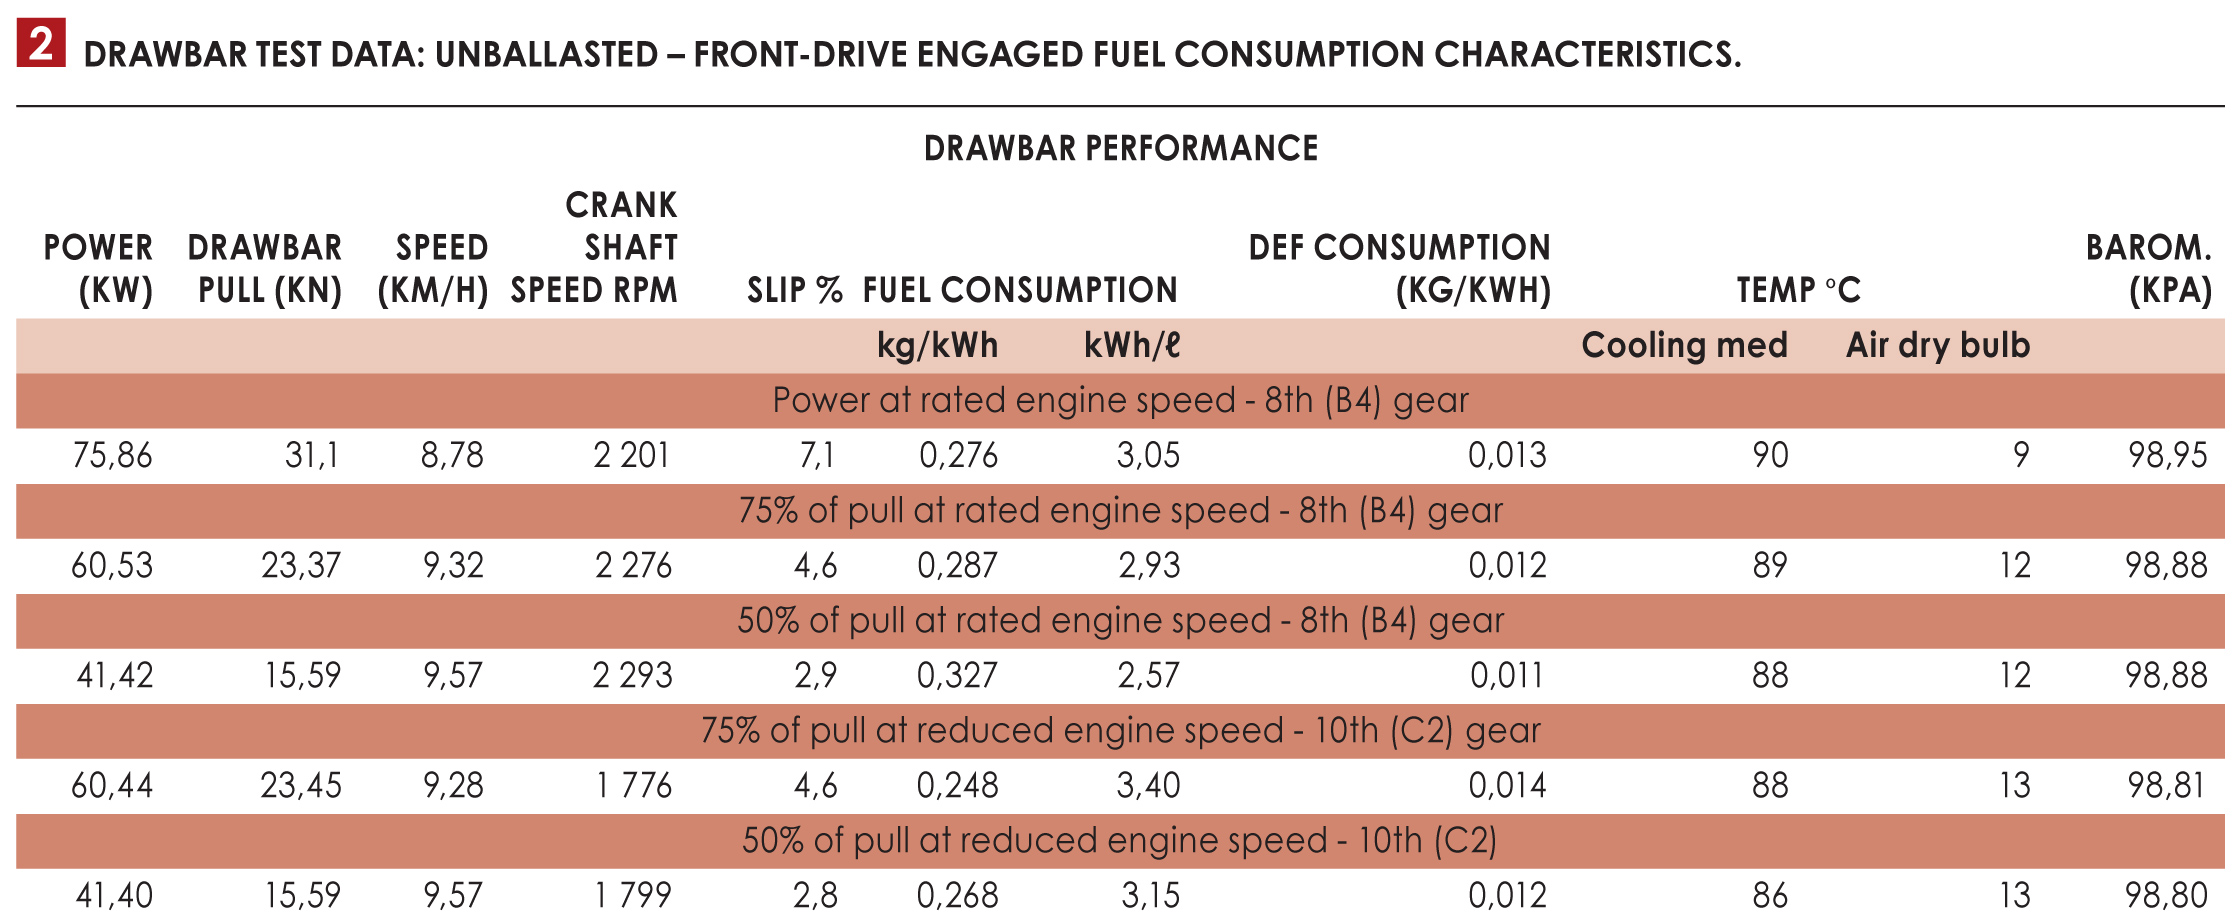 As can be seen, significant fuel savings are obtained by shifting the tractor up and throttling back. Many newer tractors feature a continuously variable transmission (CVT) or even a traditional transmission with an automatic setting that allows the tractor to manage both the transmission and throttle. The use of such systems will result in significant fuel savings – even with purely manual transmissions, the principle of shifting up and throttling back will result in fuel savings. Tractors in the field typically only average between 30% and 70% of the available power.
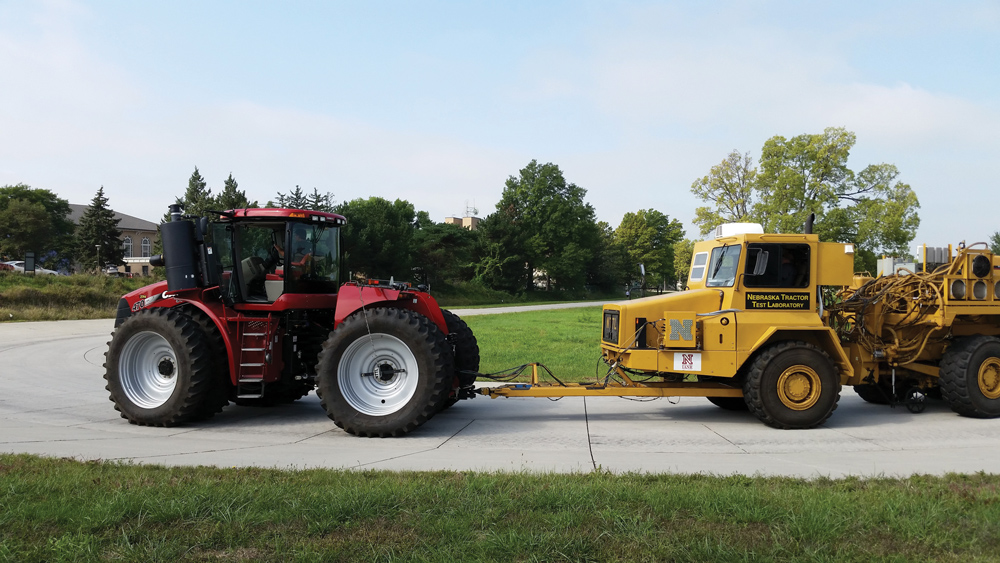
Gears selected for testing are those that are considered field gears. A field gear is a gear that produces a travel speed between 3 and 16 km/h when unloaded. Sixth gear was the gear that generated the most drawbar pull without exceeding 15% slip. Generally, best tractive performance is achieved at a slip between 10% and 12% for wheeled tractors. Some track units rarely exceed 3% slip. The NTTL requires tractors to be tested in an unballasted condition.
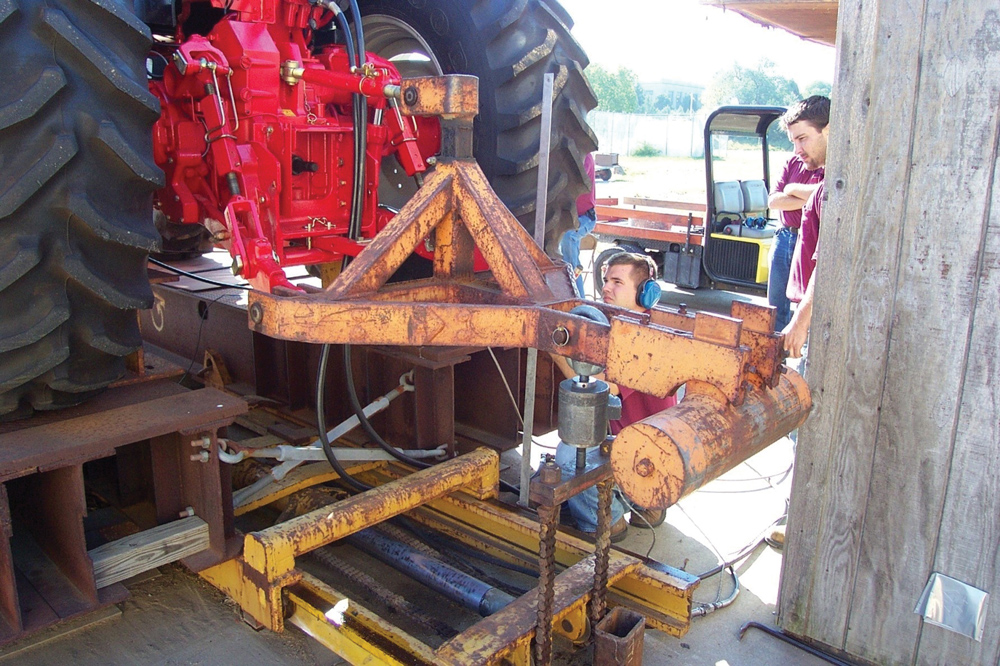
Hydraulic and three-point lift testing
For this tractor, two options of lift cylinders are reported depending on which option is present on the tractor. The force reported is the maximum force that is available throughout the full range of the hitch at the hitch balls. Readers should be warned that this is not necessarily the full force that can be utilised. Depending on how the tractor is ballasted, the tractor front end may rise if the front axle weight is not sufficient. This test is always conducted with a single outlet pair and usually with two or three pairs as well to determine the full hydraulic capacity.
Sound power testing
Here the sound power at the operator’s ear at two different engine speeds with front-wheel drive both engaged and disengaged is reported. These are comfortable sound levels. Generally, sound power below 85 dB(A) does not require hearing protection or sound monitoring programmes. The bystander sound level test measures the sound a bystander may be exposed to as the tractor drives by at a distance of 25 feet (7,5 m) from the centreline of the tractor. The test is conducted at 75% of the maximum attainable speed in the highest transport gear.
Pulling a ripper requires larger, more powerful tractors than other operations. To develop the correct soil shear, a higher speed of 9 to12 km/h is required and the drawbar loads are high. Since power = force x travel speed, higher HP tractors are necessary and ballasted tractor weight is usually around 120 to 140 lbs/PTO HP. Since the price of a tractor is usually directly proportional to its power, there is an inherent bias on the part of dealers to sell producers larger tractors than necessary.
I know of cases where a dealer will ask a producer if he ever does any ripping and gets a ‘once in a while’ answer. The dealer then convinces the producer to buy more HP than needed for other tasks. My advice is for producers to either have one high HP tractor dedicated to only high-power applications or – if multiple tractors are not an option – to simply contract out the high-power needs when required.
Tractors are most fuel efficient when they are heavily loaded (about 70% of total capacity). It therefore makes no sense to buy big tractors unless one is attaching them to implements that will so load the tractor. Generally, the smallest tractor that will get the job done, is the most fuel efficient. Producers would be well advised to follow this rule when making purchasing decisions.
For more information contact Prof Roger M Hoy at rhoy2@unl.edu.


