


Dr Johan Labuschagne, Western Cape Depart-ment of Agriculture, Elsenburg and Depart-ment of Agronomy, Stellenbosch University
 Prof Pieter Swanepoel, Department of Agronomy, Stellenbosch University
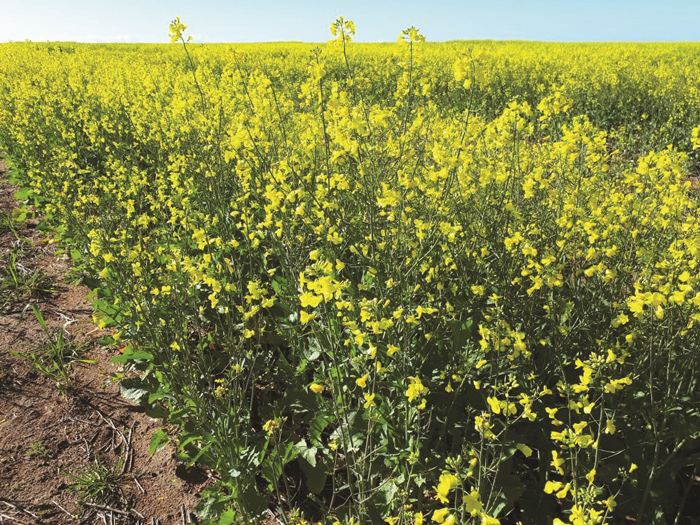
Most canola producers in the Western Cape have adopted conservation agriculture (CA). As a result of less soil disturbance, implementing crop rotation and preserving stubble (or inclusion of cover crops), the chemical, physical and biological characteristics of the soil improved dramatically.
The resultant higher soil organic carbon (C) content, improved soil structure and more favourable environment to host a more diverse microbial population, ensured improved crop productivity and resilience. The increased availability of inorganic nitrogen (N) in CA systems may result in reducing fertiliser N requirements.
During 2016, Dr Johan Labuschagne – at that stage a scientist at the Western Cape Department of Agriculture – identified the need to perform in-field N trials to refine current canola norms. Prof Pieter Swanepoel (Stellenbosch University) and Dr Izané Crous (Omnia Holdings) joined the team later – Prof Swanepoel as co-study leader and Dr Crous as a PhD student. A similar study was done on wheat at the same sites as the canola study. Responses of wheat after canola and legumes (medics, lupin and lucerne) to increased fertiliser N rates were investigated. A PhD student, Annemarie van der Merwe (Western Cape Department of Agriculture), is currently attending to the wheat data. In the wheat studies images from the Normalised Difference Vegetation Index (NDVI) will also be used in correlation with N fertiliser rates and chlorophyll (SPAD) readings to determine the in-season N status of the crop and the potential to respond to N applications.
Canola trials
Canola trials were established at Riversdale, Riviersonderend (Tygerhoek), Moorreesburg (Langgewens), Darling and Porterville to investigate the effect of different N rates on canola seed yield and oil content. At all the sites, canola followed wheat in the crop rotation systems. The N treatments consisted of a control treatment, where no N fertiliser was applied, and treatments where 25 kgN/ha were applied at planting. Depending on the type of planter used, between 5 and 15 kg N/ha were placed in or beneath the row during planting and the rest broadcasted by hand, immediately followed by the planting process. N topdressings were applied at the four to six leaf stage at rates of 0, 25, 50, 75, 105, 135 and 165 kg N/ha. Total N applied was therefore 0, 25, 50, 75, 100, 130, 160 and 190 kg N/ha.
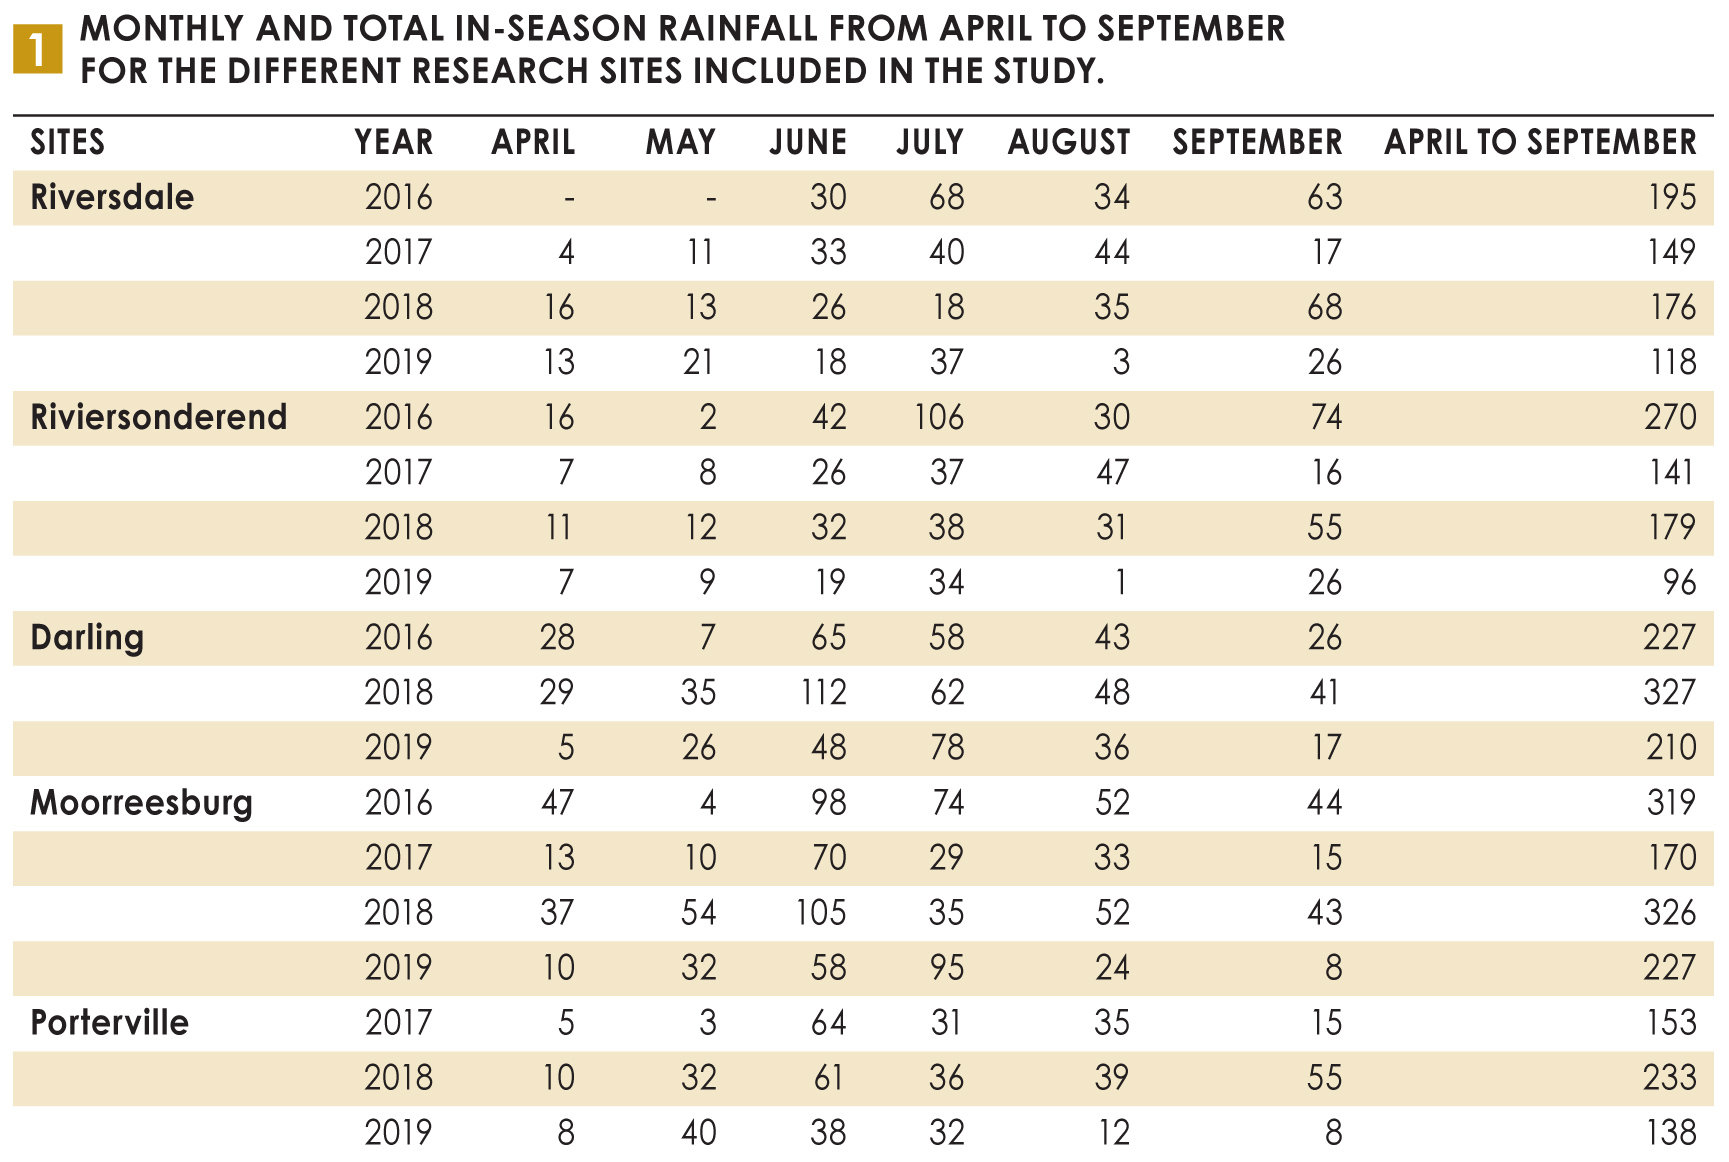
Soils differed with shallow, sandy loam soil at Riversdale; shallow shale-derived soil at Riviersonderend and Moorreesburg; deep, reddish clay-loam soil at Porterville and deep sandy soil at Darling. High stone contents characterise the soils at Riversdale, Riviersonderend and Moorreesburg. The soil carbon content of the soils at Riversdale and Riviersonderend was higher than at the other sites. In-season rainfall received during the study period is summarised in Table 1.
 For the purpose of this publication, only the response of canola to N application rates in terms of seed yield and oil content will be reviewed. Seed yield in response to N fertiliser rate varied between years at all sites during the years covered by the study (2016 to 2019). Rainfall and the distribution thereof played a crucial role in canola’s response to fertiliser N rate. These results from the study prove that there are no fixed recipes for the N rate required and that N rate is influenced by, amongst others, the environmental conditions during the growing season. It is particularly important to note that the focus was to identify the N rate where further increases in fertiliser N rate did not result in significant response in canola seed yield.

Results
During the 2019 season at Riversdale (Figure 1) no significant response to N fertilisation was observed. This finding is the exception rather than the rule. It can, however, be explained by low in-season rainfall (118 mm) including a dry September (26 mm) that most probably restricted seed filling. During the 2016, 2017 and 2018 seasons canola yields at applications of 50, 25 and 75 kg N/ha, respectively, did not differ significantly from the maximum yields recorded. The lack of response to N in 2017 was caused by a dry September (17 mm) adversely affecting the seed-filling stages. The 2016 and 2018 seasons were characterised by sufficient in-season and high rainfall during September.
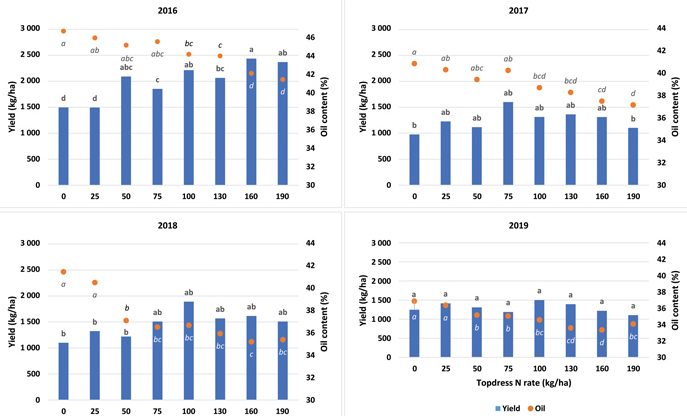
No common letter above bars and below dots (italics) indicates differences (p < 0,05) between mean seed yield or oil content, respectively.
Riviersonderend
During 2016, 2018 and 2019 at Riviersonderend (Figure 2) no significant increases in yields were recorded when N rates were increased above 50 kg N/ha. In-season and September rainfall were relatively high during 2016 (270 and 74 mm) and 2018 (179 and 55 mm), thereby increasing yield potential accompanied by an increase in N demand of the canola crop. The response during 2019 might have been influenced by other environmental conditions as no significant yield increases were found when N application rates were increased above 50 kg N/hadespite low in-season (96 mm) as well as relatively low September (26 mm) rainfall. Due to the low in-season (141 mm) and September (16 mm) rainfall received during 2017, the canola responded only significantly to a maximum of 25 kg N/ha.
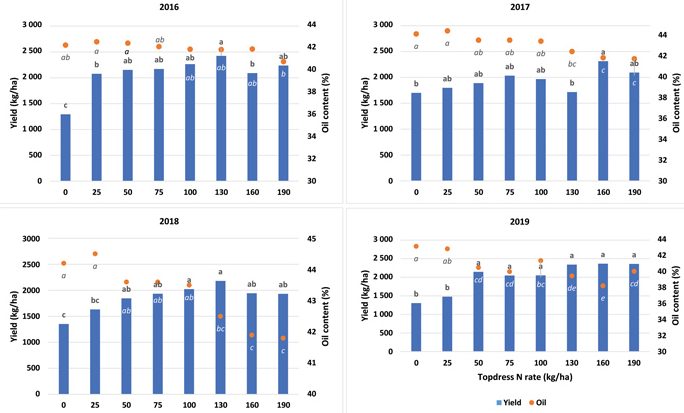
No common letter above bars and below dots (italics) indicates differences (p < 0,05) between mean seed yield or oil content, respectively.
Darling
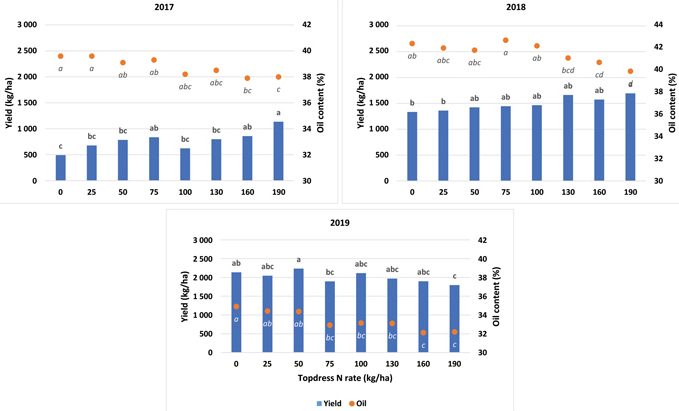
The sandy soil at Darling resulted in relatively high N demands. During 2016 and 2018 in-season and September rainfall were relatively high (Figure 3), especially in 2018 (327 and 41 mm), resulting in no significant responses where N rates were increased above 75 and 25 kg N/ha. Lower in-season (210 mm) and September (17 mm) rainfall in 2019 restricted significant yield increases to 25 kg N/ha. Leaching losses in the sandy soil of Darling complicate explaining responses to N application rates. Due to substandard establishment, the 2017 canola crop at Darling was terminated.

No common letter above bars and below dots (italics) indicates differences (p < 0,05) between mean seed yield or oil content, respectively.
Moorreesburg
Wind damage a week before harvesting in 2018 caused considerable seed loss to the Moorreesburg site and rendered data unreliable. The 2017 season was very dry and only 170 mm in-season and 15 mm September rainfall (Figure 4) were received, and the canola crop did not respond to fertiliser N application rates. The high in-season (319 mm) as well as high September (44 mm) rainfall in 2016 increased the yield potential resulting in no significant increases in yield where more than 100 kg N/ha were applied. Less in-season (227 mm) and extremely low September (8 mm) rainfall during 2019 reduced the significant response to 75 kg N/ha.
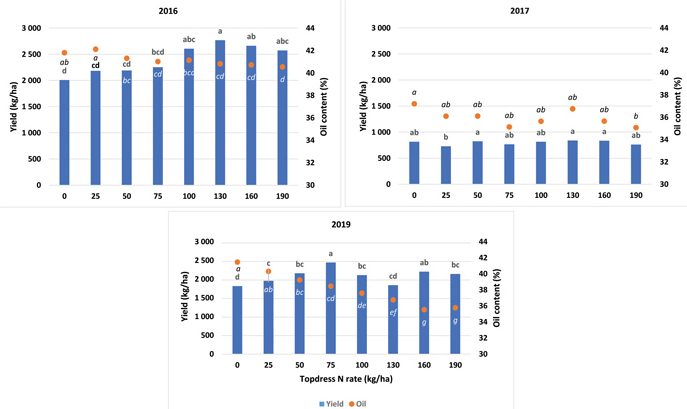
No common letter above bars and below dots (italics) indicates differences (p < 0,05) between mean seed yield or oil content, respectively.

Porterville
At Porterville, the establishment of the crop was poor in 2016. No further significant yield increases were observed where more than 75 and 50 kg N/ha were applied in 2017 and 2018 respectively (Figure 5). Response to rainfall, however, differed as only 153 mm in-season and 15 mm September rainfall were received in 2017, compared to 233 mm and 55 mm in-season and September in 2018. Although yields were relatively high in 2019, low in-season (138 mm) and very low September (8 mm) rainfall resulted in no responses to N rates.
No common letter above bars and below dots (italics) indicates differences (p < 0,05) between mean seed yield or oil content, respectively.
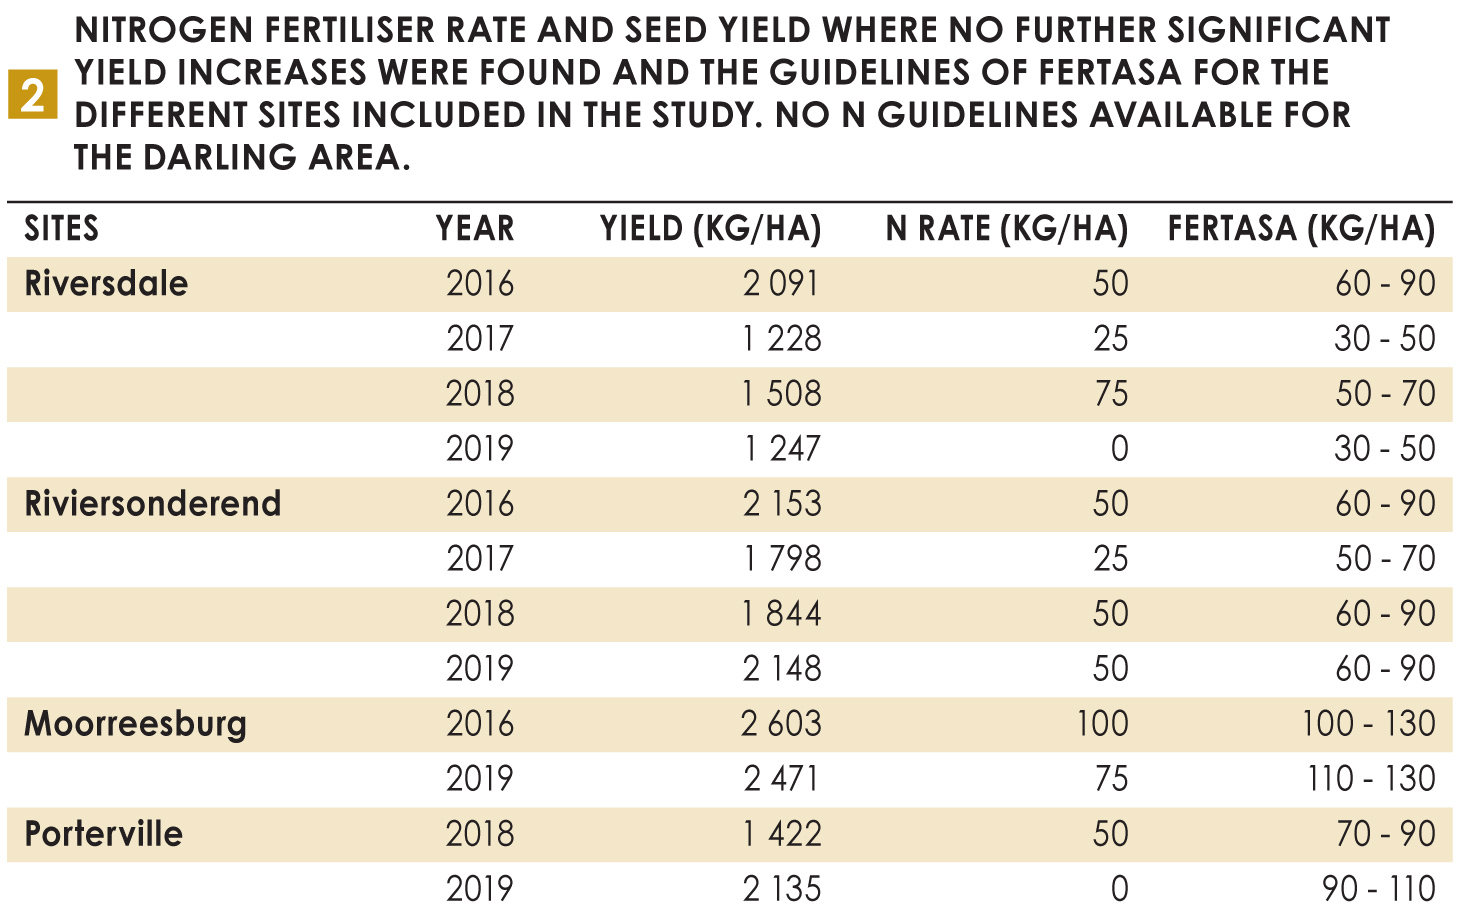
Comparing the N rate and seed yield where no further significant yield increases were found as N rate was increased with the guidelines of FERTASA, demonstrates that fertiliser N demand is lower under CA (Table 2). At all sites and years, the oil concentration (%) tended to decrease as N rates were increased. Oil content often declined to concentrations below 40% at the higher N rates.
 The authors would like to acknowledge the permission granted by the Western Cape Department of Agriculture for allowing the use of the data for Dr Crouse’s PhD.


