


Johan Teessen, agricultural economist intern, Grain SA
The BFAP Baseline holds a prominent place on the agricultural calendar and celebrates its 20th anniversary this year. This annual report offers a comprehensive perspective on agricultural production, consumption, prices, and trade in South Africa, covering the period from 2023 to 2032.
This article will extract and present the critical insights that shape the grain industry, addressing its impact on both local and international markets, and examining its significance for South African grain producers.
International market outlook for 2023 to 2033
Internationally, the drought risk in the United States (US), dryness across Europe, El Niño in South America and the disruption in production and export of grain in Ukraine, are the current market drivers. Viewing the global cereal outlook, some relief was seen with mitigation in input costs. Furthermore, the cereal outlook shows that the US as well as South America expect larger crops for the 2023/2024 season. According to the International Grains Council (IGC), it is expected that maize production could increase with more than 5% year on year in 2023. The demand from China to import also grew substantially and is set to grow by 13,2% for the 2023/2024 season. In contrast to maize and soybean production, wheat production decreased.
According to the IGC, total wheat production is set to decrease with less than 1%. Global oilseed trends showed interesting developments in the European Union (EU). The area under production of rapeseed, sunflower and soybean has seen an increase mainly due to incentives for protein crops, a decrease in Ukraine’s production and the recovery of rapeseed after a ban on neonicotinoids. Although the EU is expanding its oilseed production, the total market’s stocks is busy decreasing due to the fact that Ukraine holds such a significant market share in sunflower.
Current realities that will ultimately influence the international outlook for the baseline over the next decade include the ongoing economic pressure with ample downside risk, change in the international trade environment, the ongoing war in Ukraine and volatile weather conditions. Other avenues for grain include biofuels as well as the meat and dairy industries. One of the key drivers for the international baseline outlook is the demand for vegetable oil for biofuels. Renewable diesel production is projected to increase and the ethanol consumption is expected to be flat in the US.
The meat price index of the Food and Agriculture Organisation (FAO) shows that post-Covid the meat demand is strong in both the US and the EU. Production responses, however, were constrained due to high input costs, disease, and weather conditions. Moreover, meat prices are either at record or close to record prices for the US and the EU. Global dairy movements portray a flatter long run curve in the production of milk looking at the EU, New Zealand, and Australia’s markets. Looking at China’s market, it can be seen that along with imports, its local production is increasing.
Local market outlook for 2023 to 2033
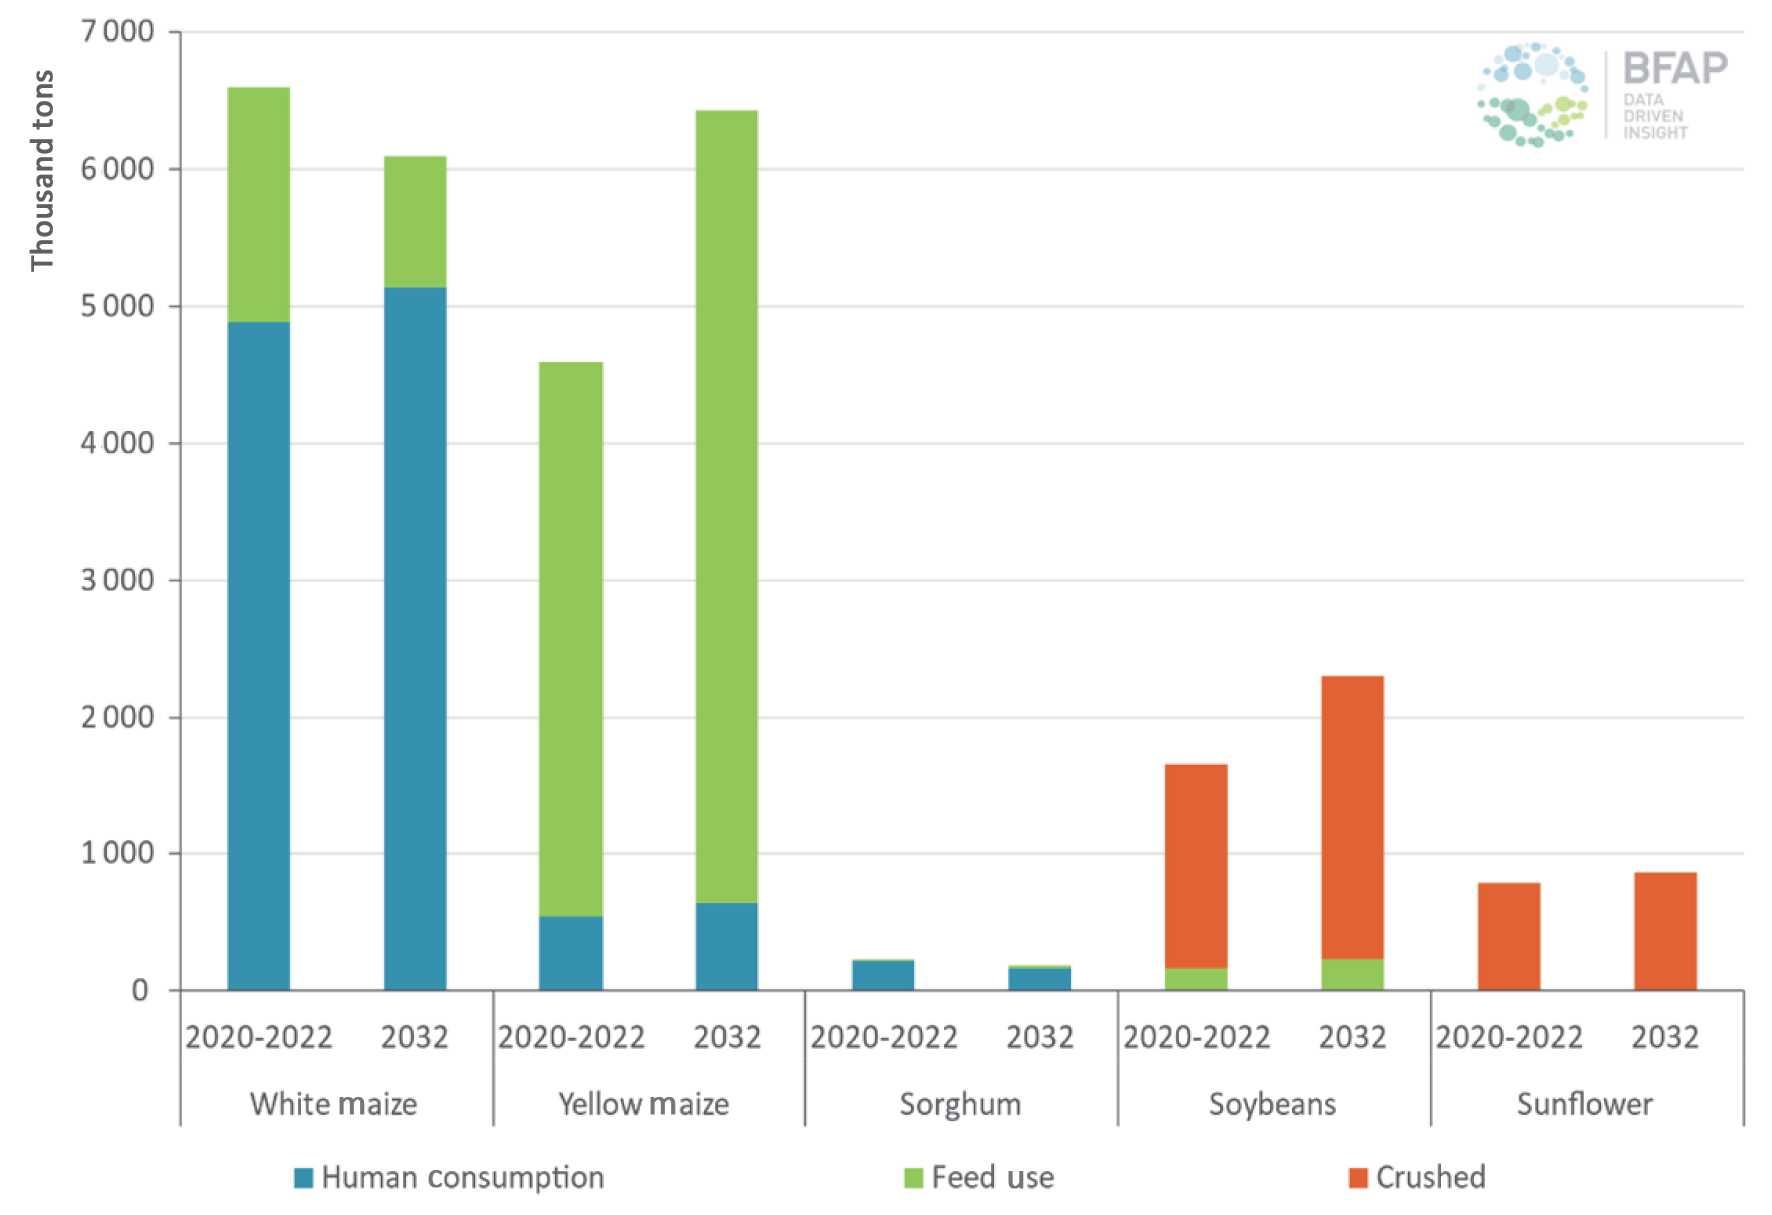
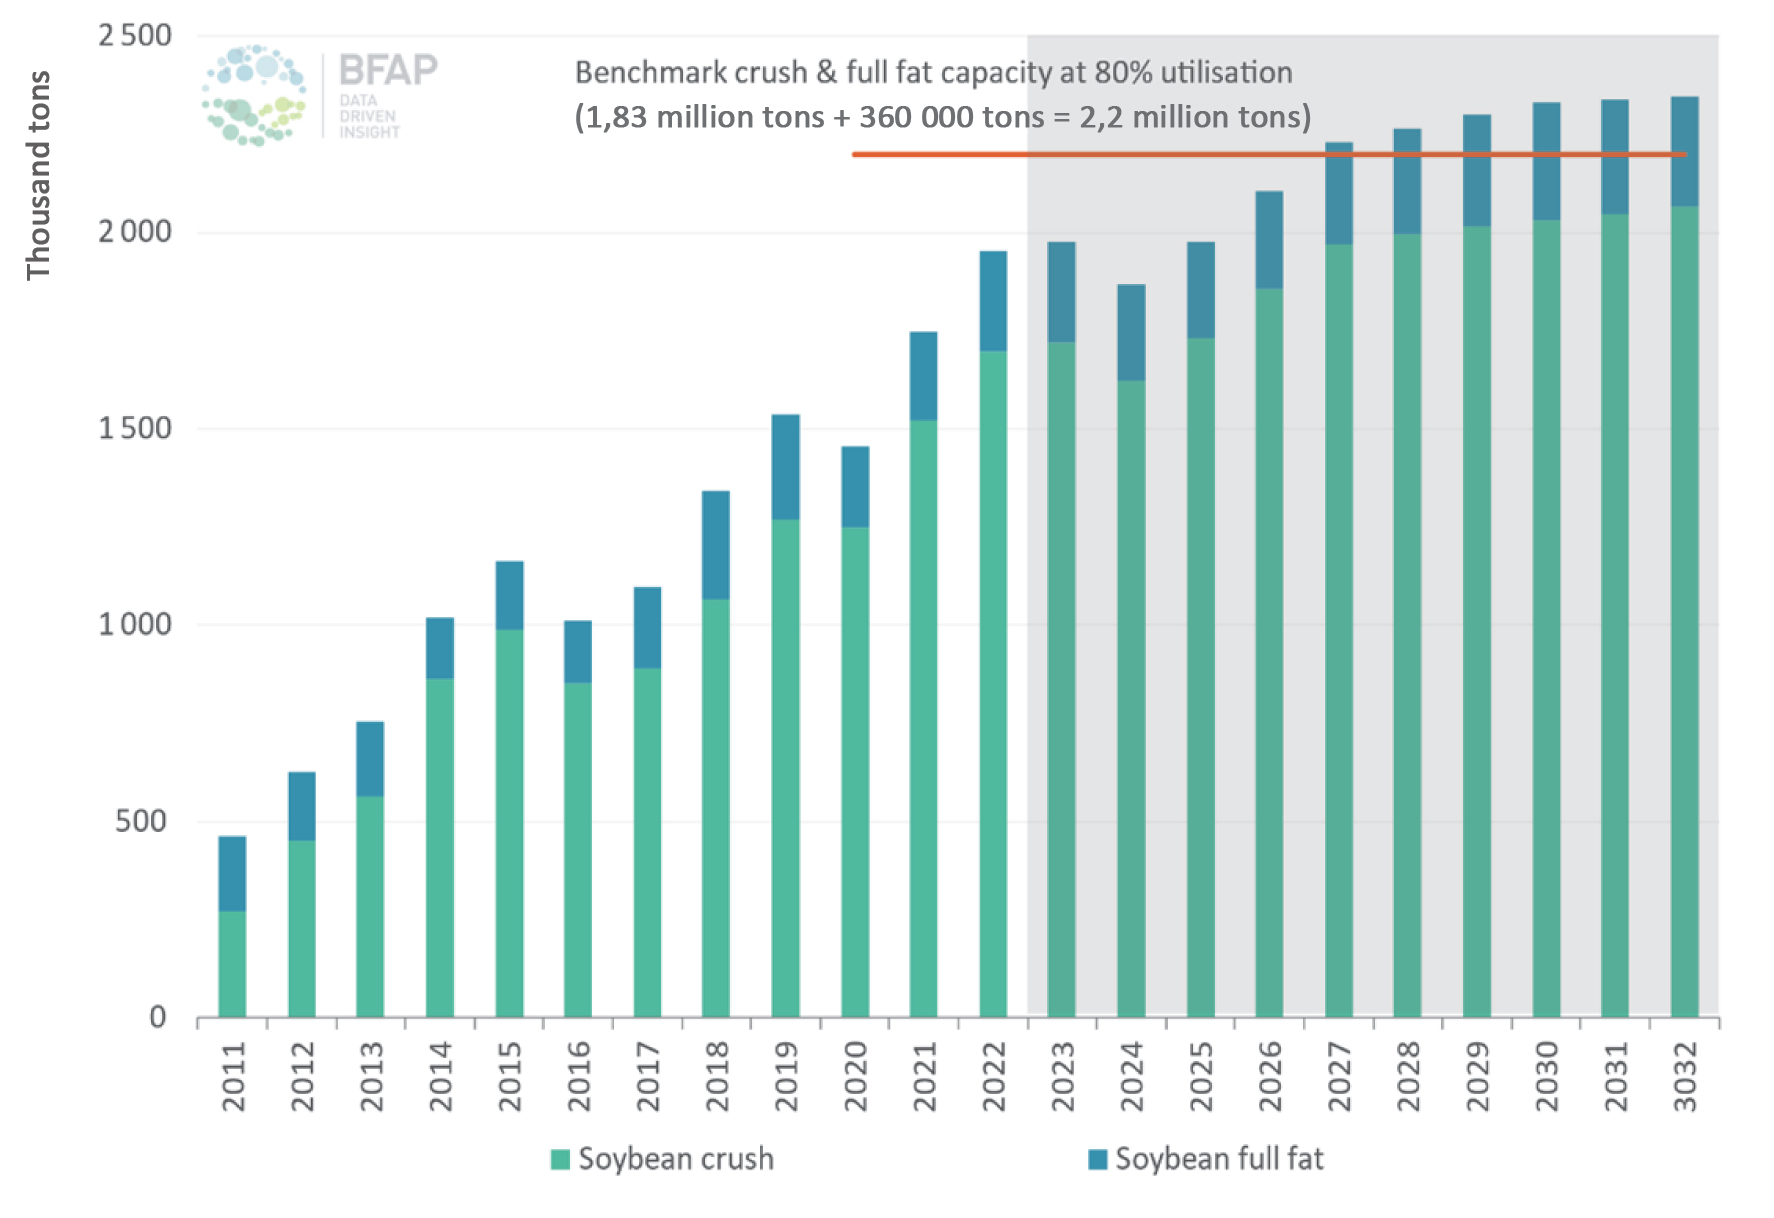
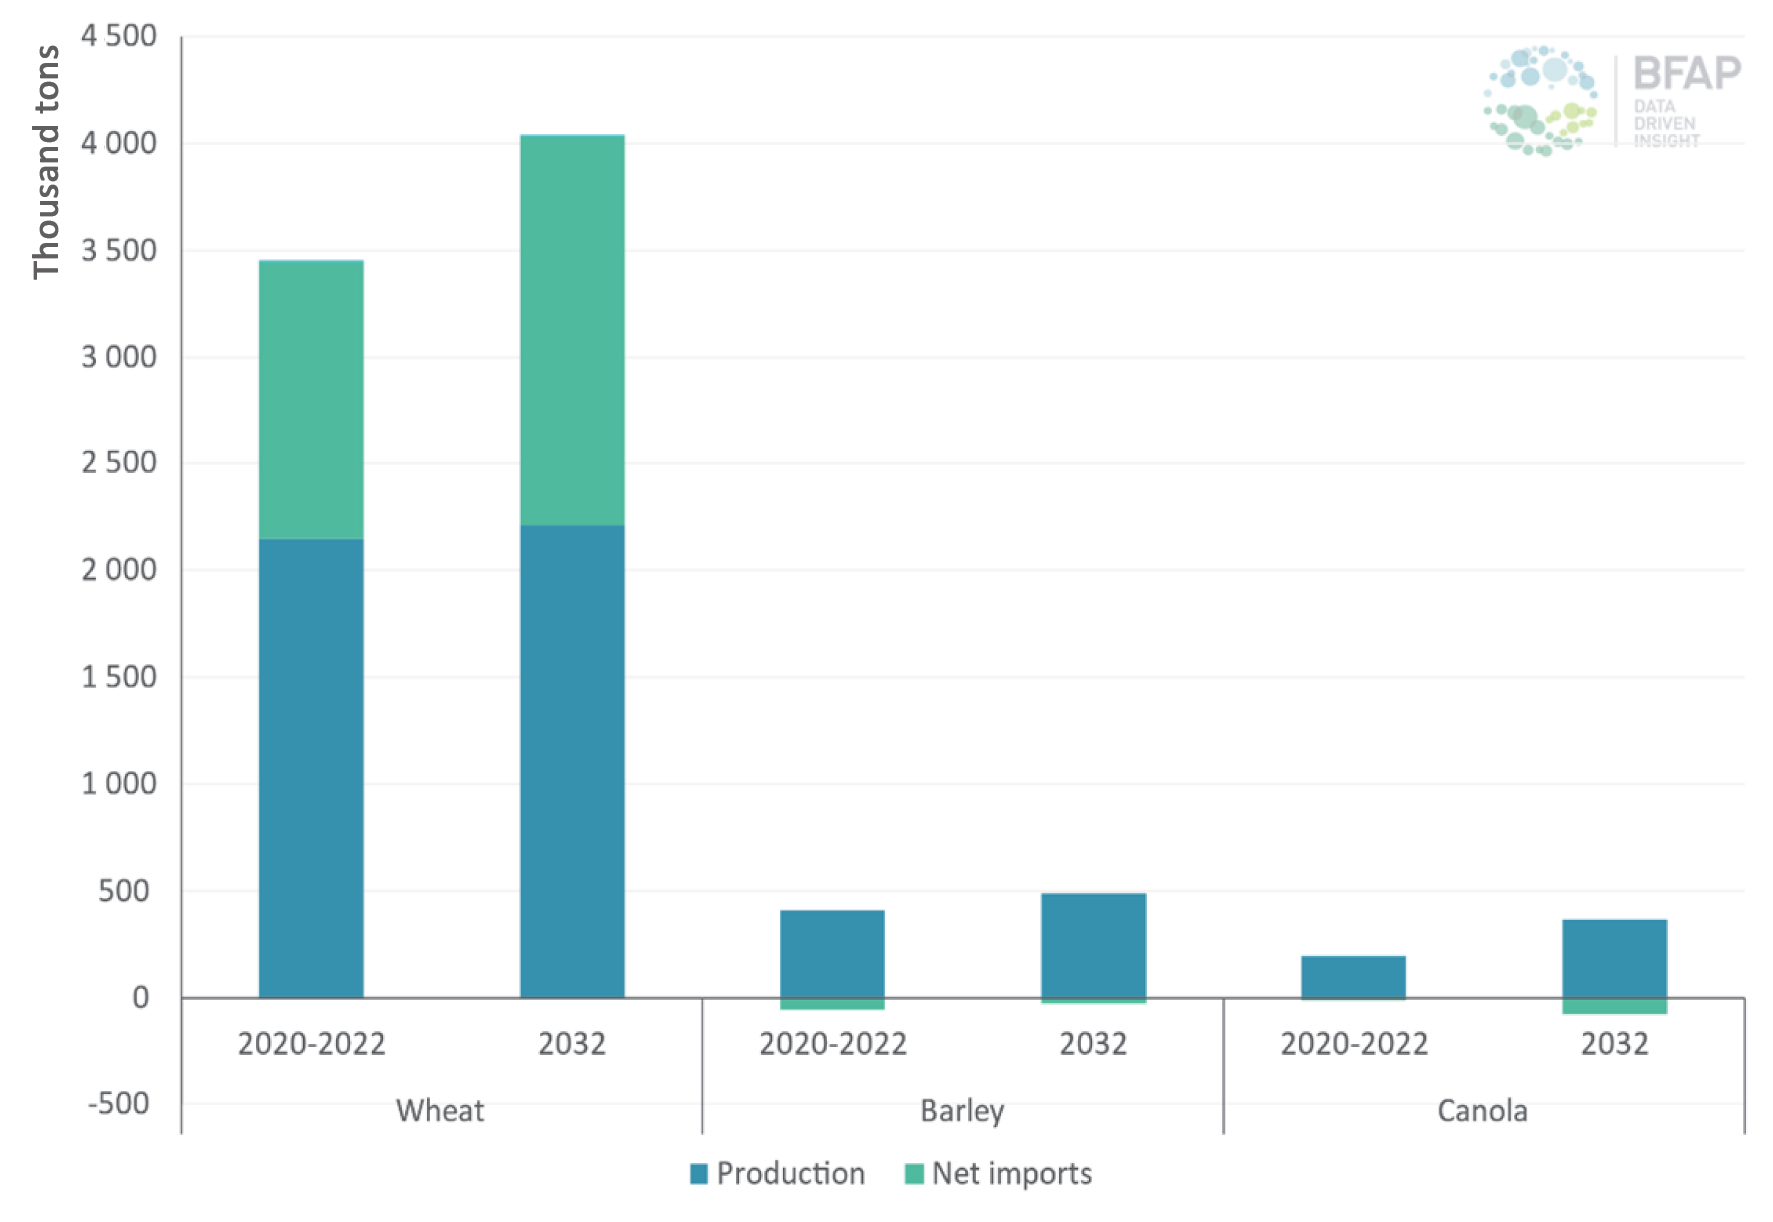
The demand and growth for summer crops differ depending on the typical usage for the specific crop. These uses differ from consumption as a staple food, animal consumption, and the production of vegetable oils for the consumption of both humans and animals. Graph 1 shows the usage of each summer crop in 2032 relative to the 2020-2022 base period by using human consumption, feed use, and crushing. High profitability in recent years is a key reason for the expansion of these crops, with irrigated summer crops being much more profitable.
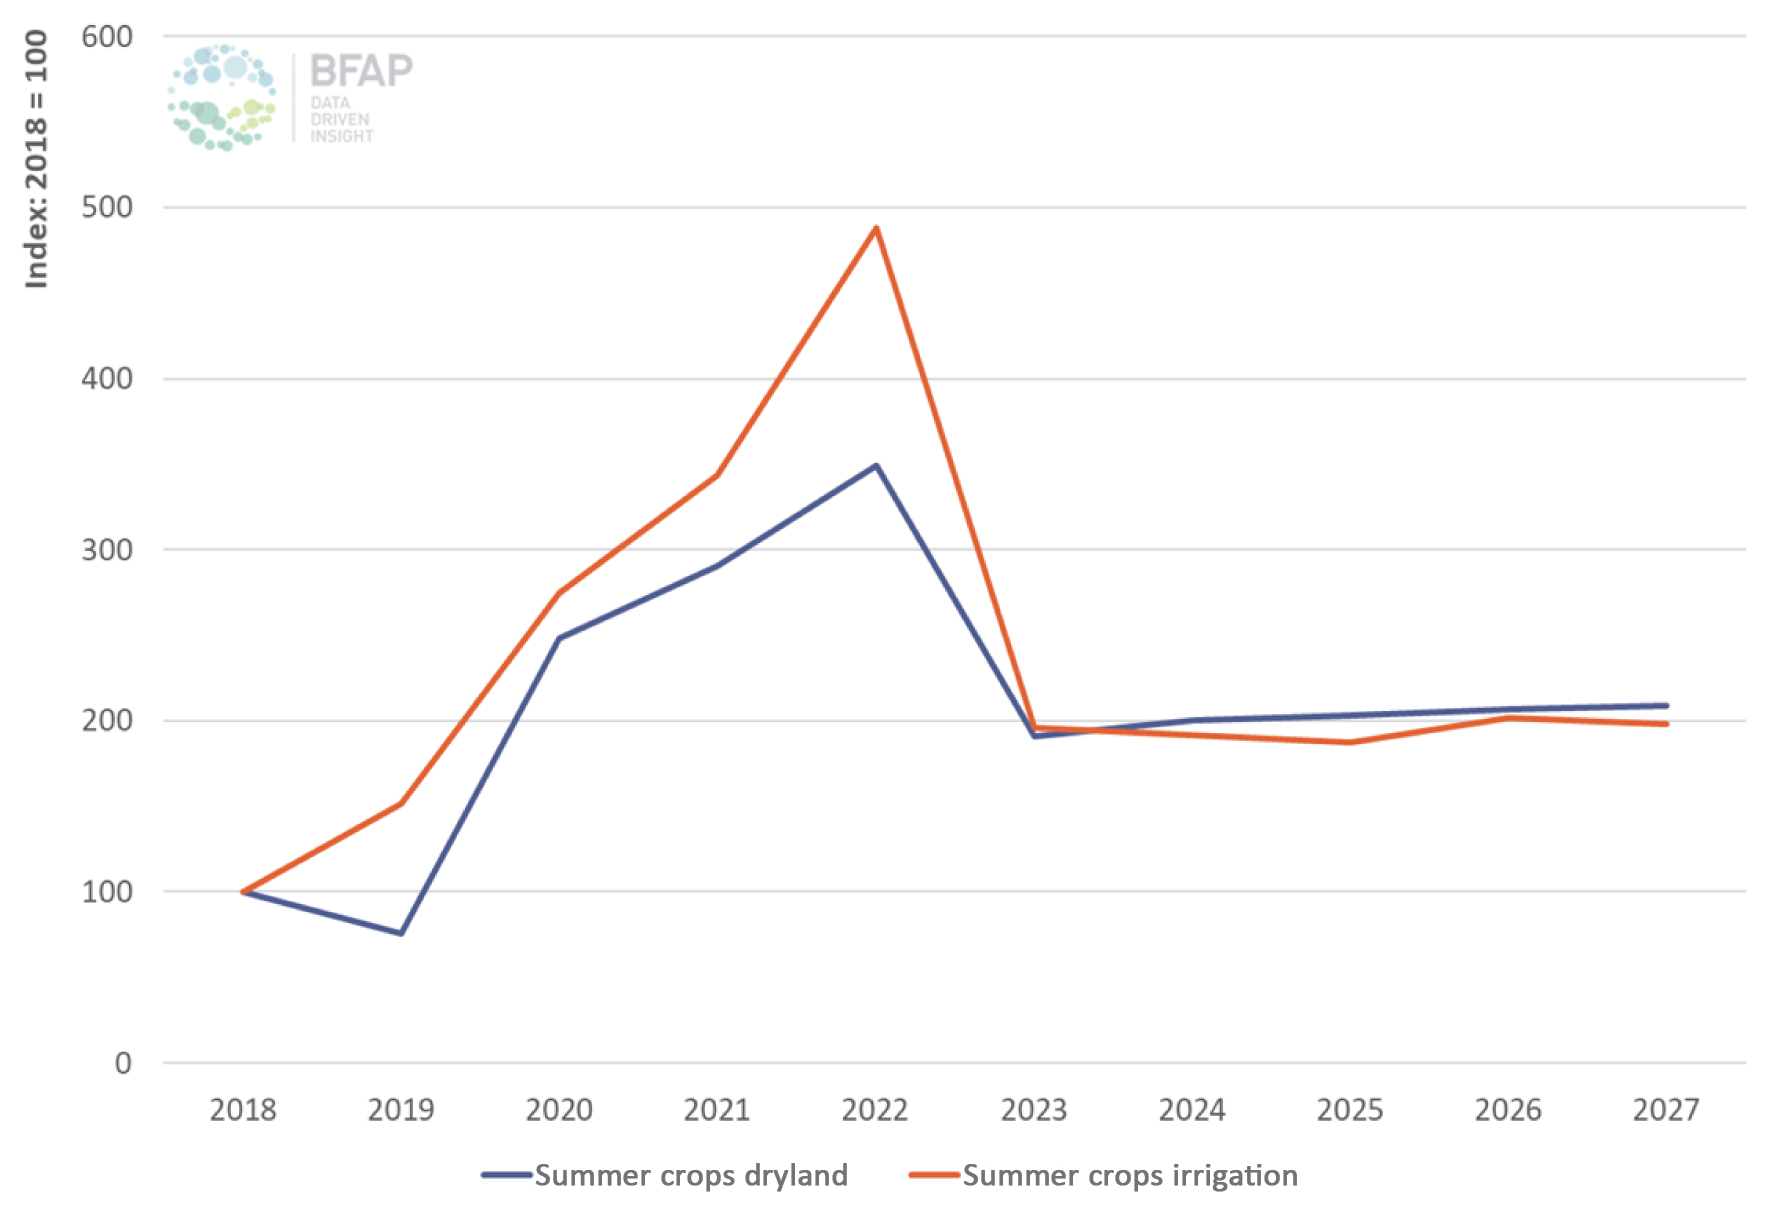
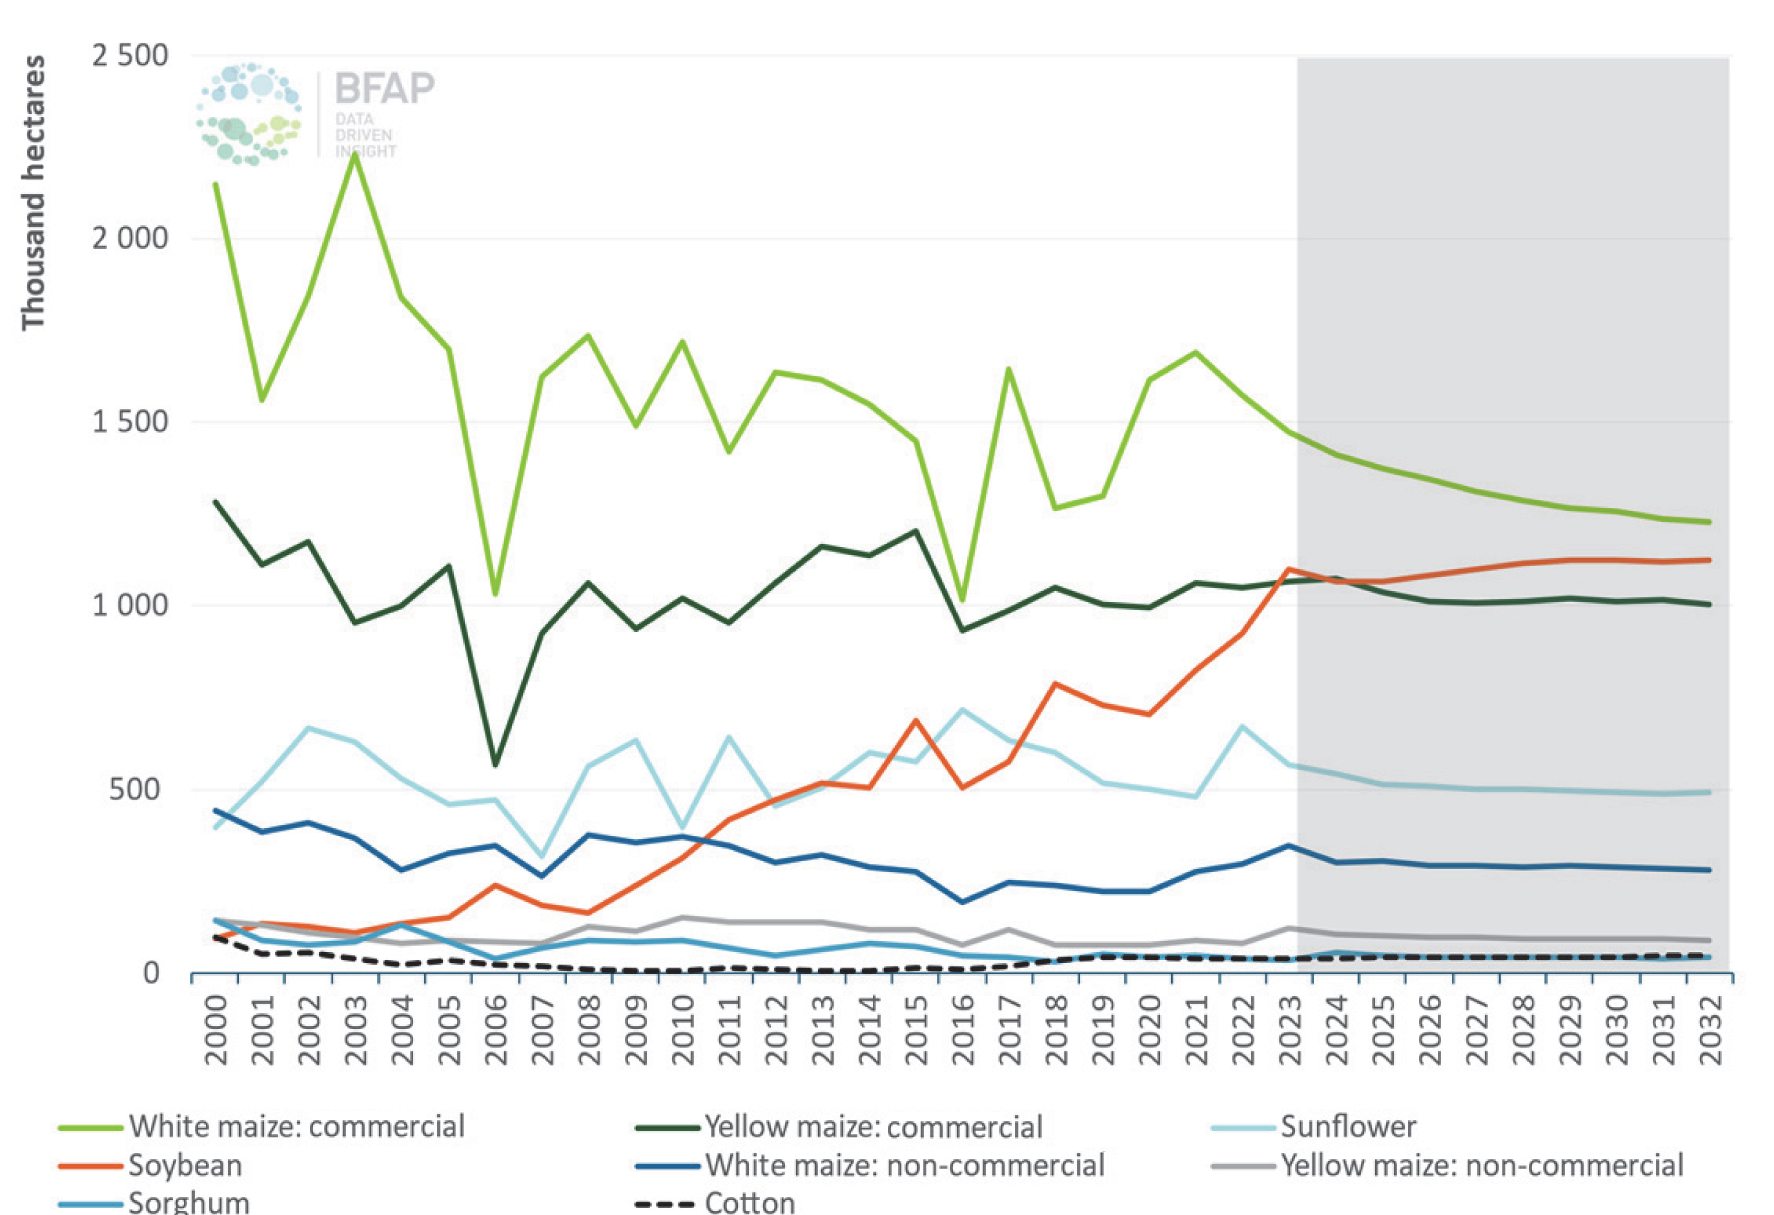
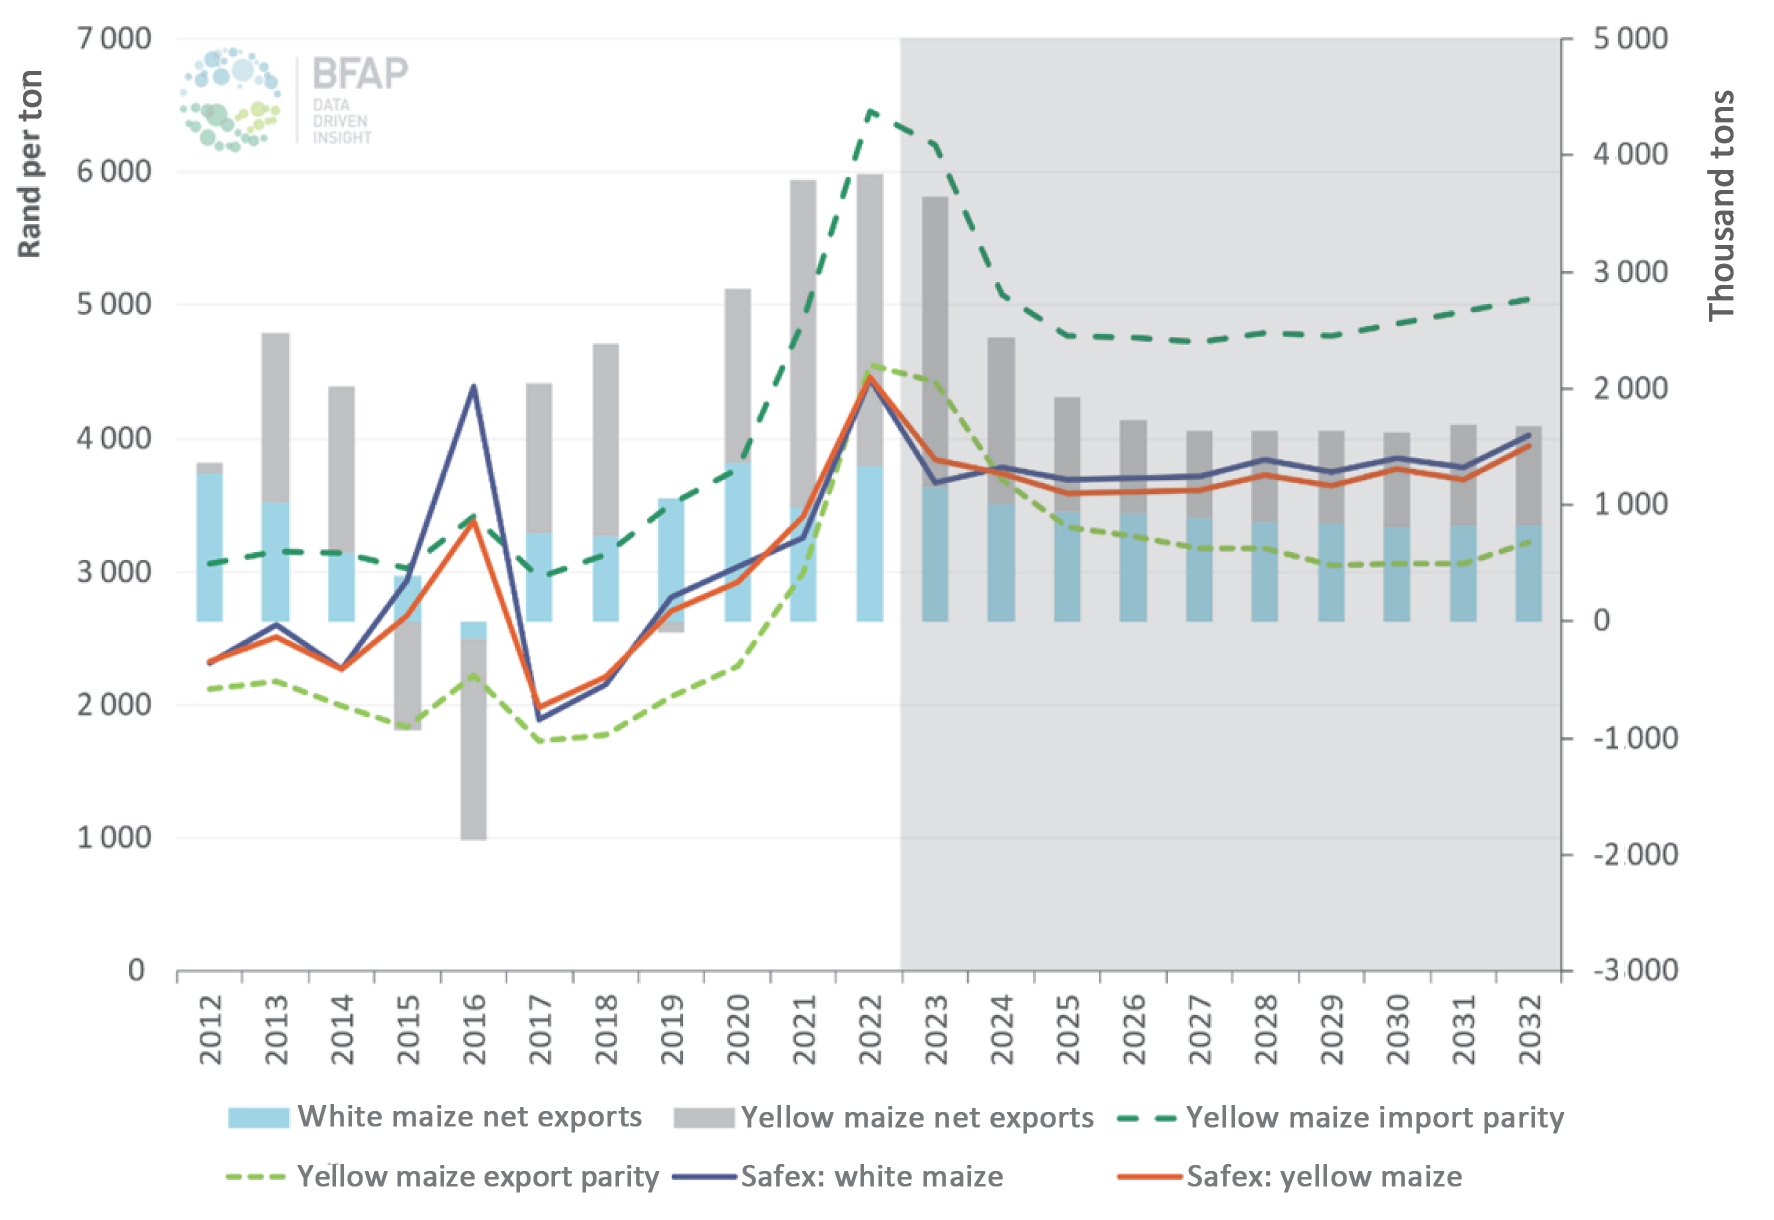
However, looking forward it seems that dryland may be a slightly better option when considering Graph 2. Mentioning the expansion of the area planted due to profitability, Graph 3 shows the rapid expansion of commercial white maize between 2018 and 2021, and the same with soybeans, but between 2020 and 2023. Graph 4 shows the production, consumption, trade, and price of soybeans. The increase in production from 2020 until 2022 can be seen, but it should also be noted that domestic consumption has increased with it and imports have decreased.
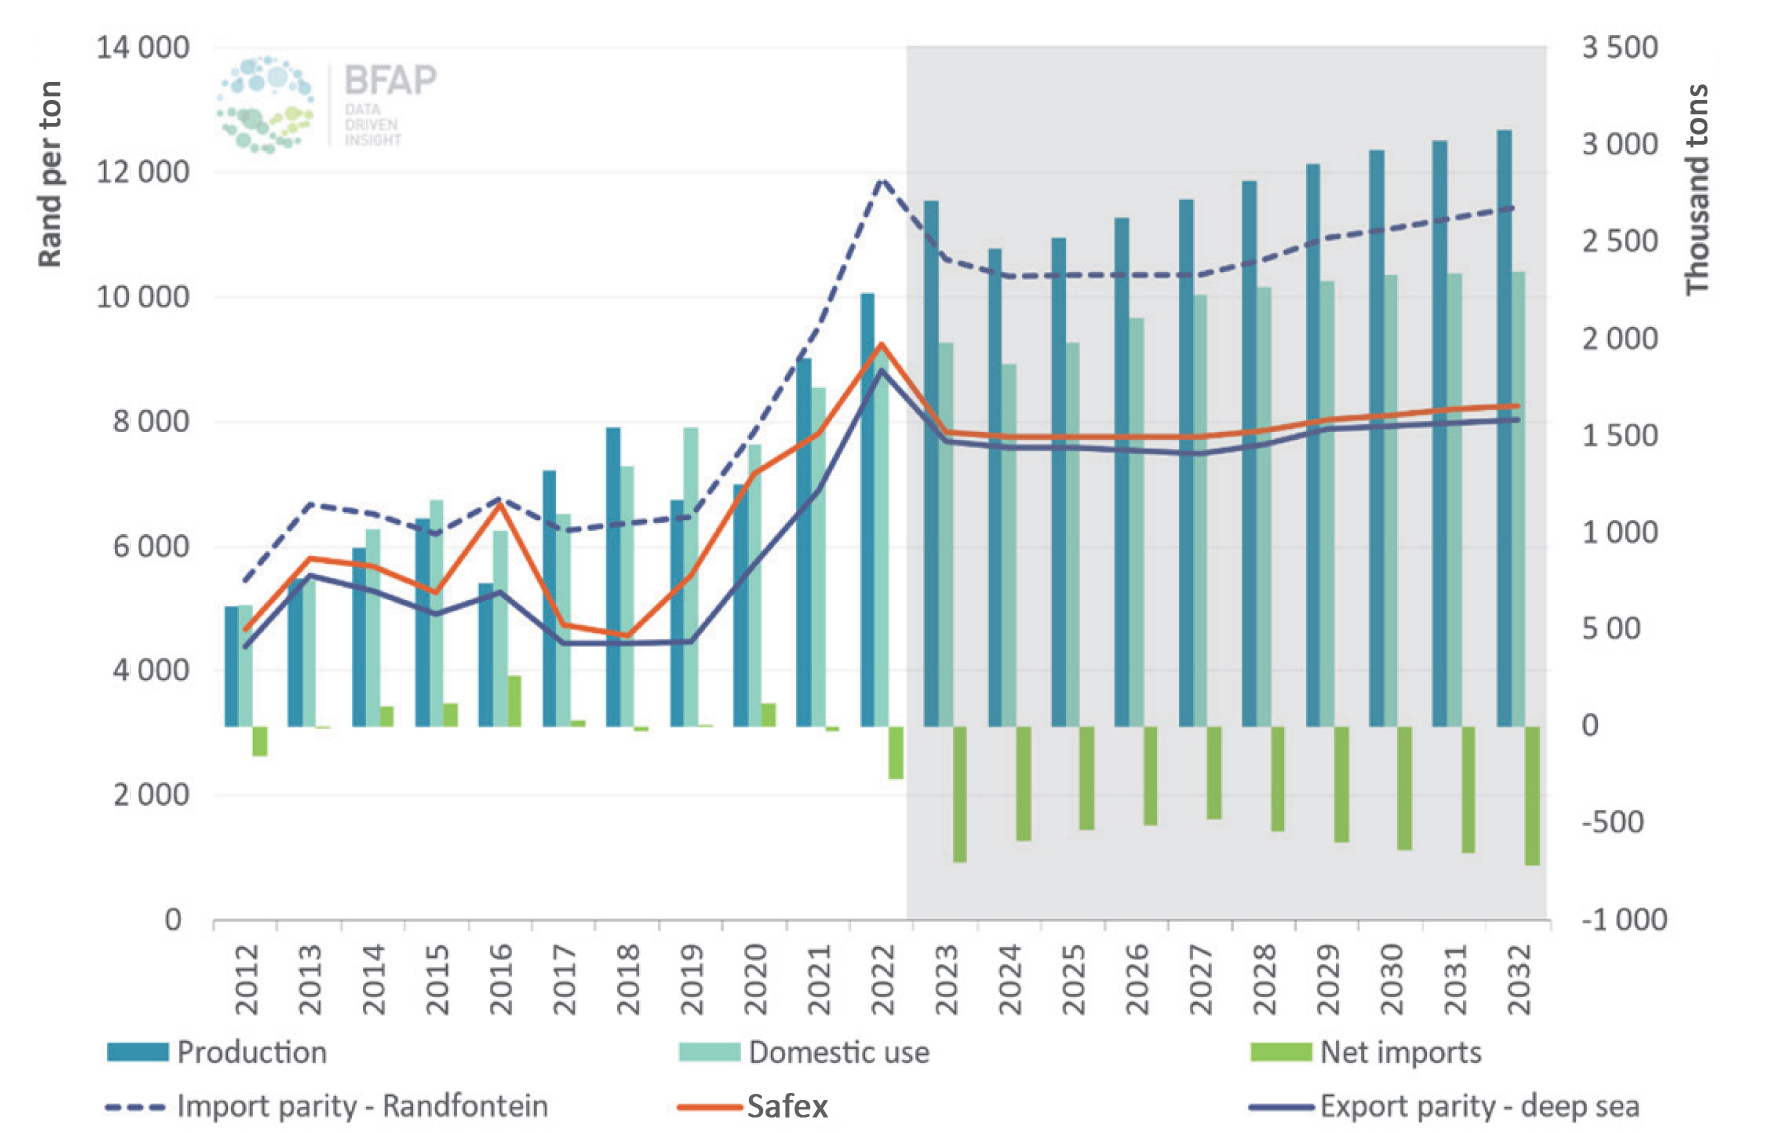
It is also evident that the Safex price of soybeans is trading higher than the export parity price and seems to mirror the forecasted export parity price at Randfontein from 2023 until 2032. Taking a deeper look at domestic use in Graph 5, an increasing trend for soybeans is evident, with the trend slowing down from 2028 until 2032. Going back to maize in Graph 6, the expectation for maize net exports and prices are to decrease sharply from now until 2026 and from there to move sideways until 2032, where the forecasting stops. White maize follows the same trend, but with the decrease in exports being more gradual.
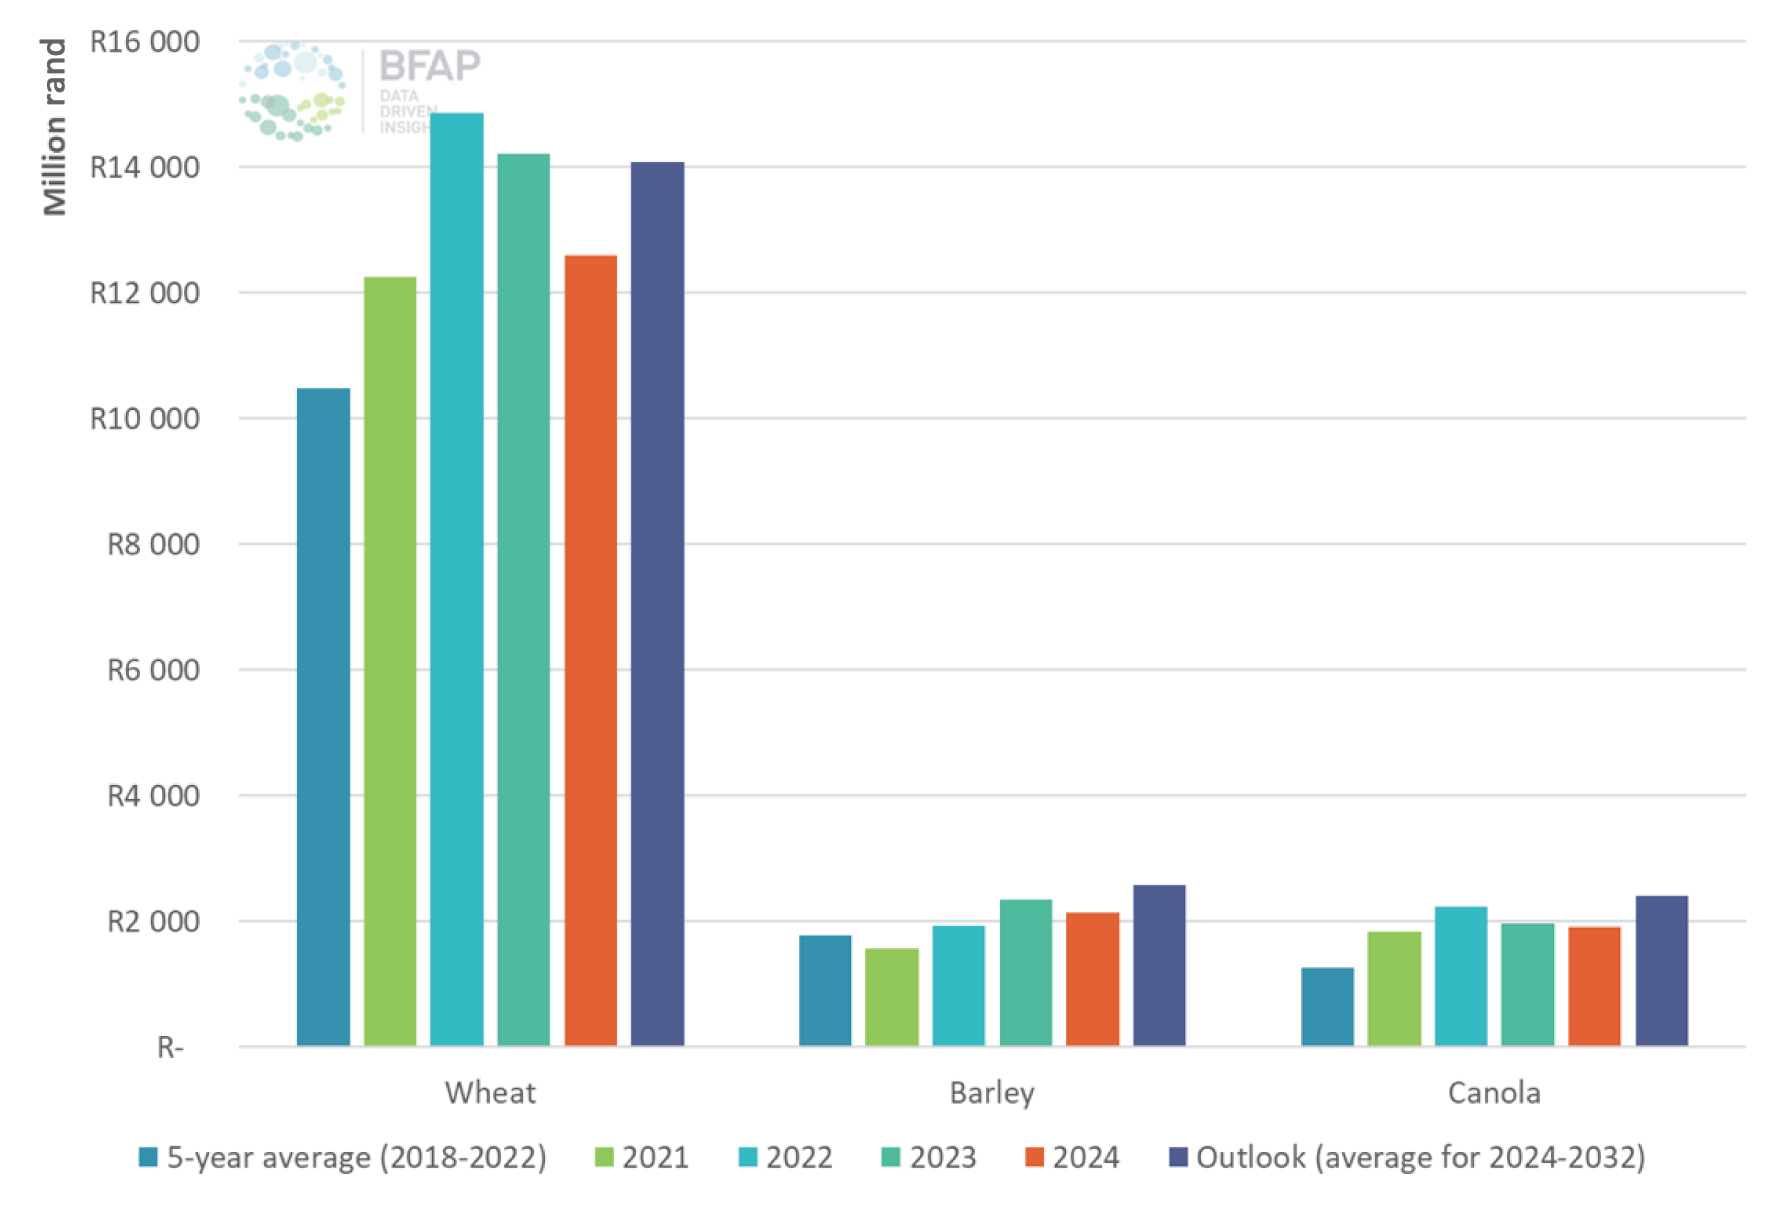
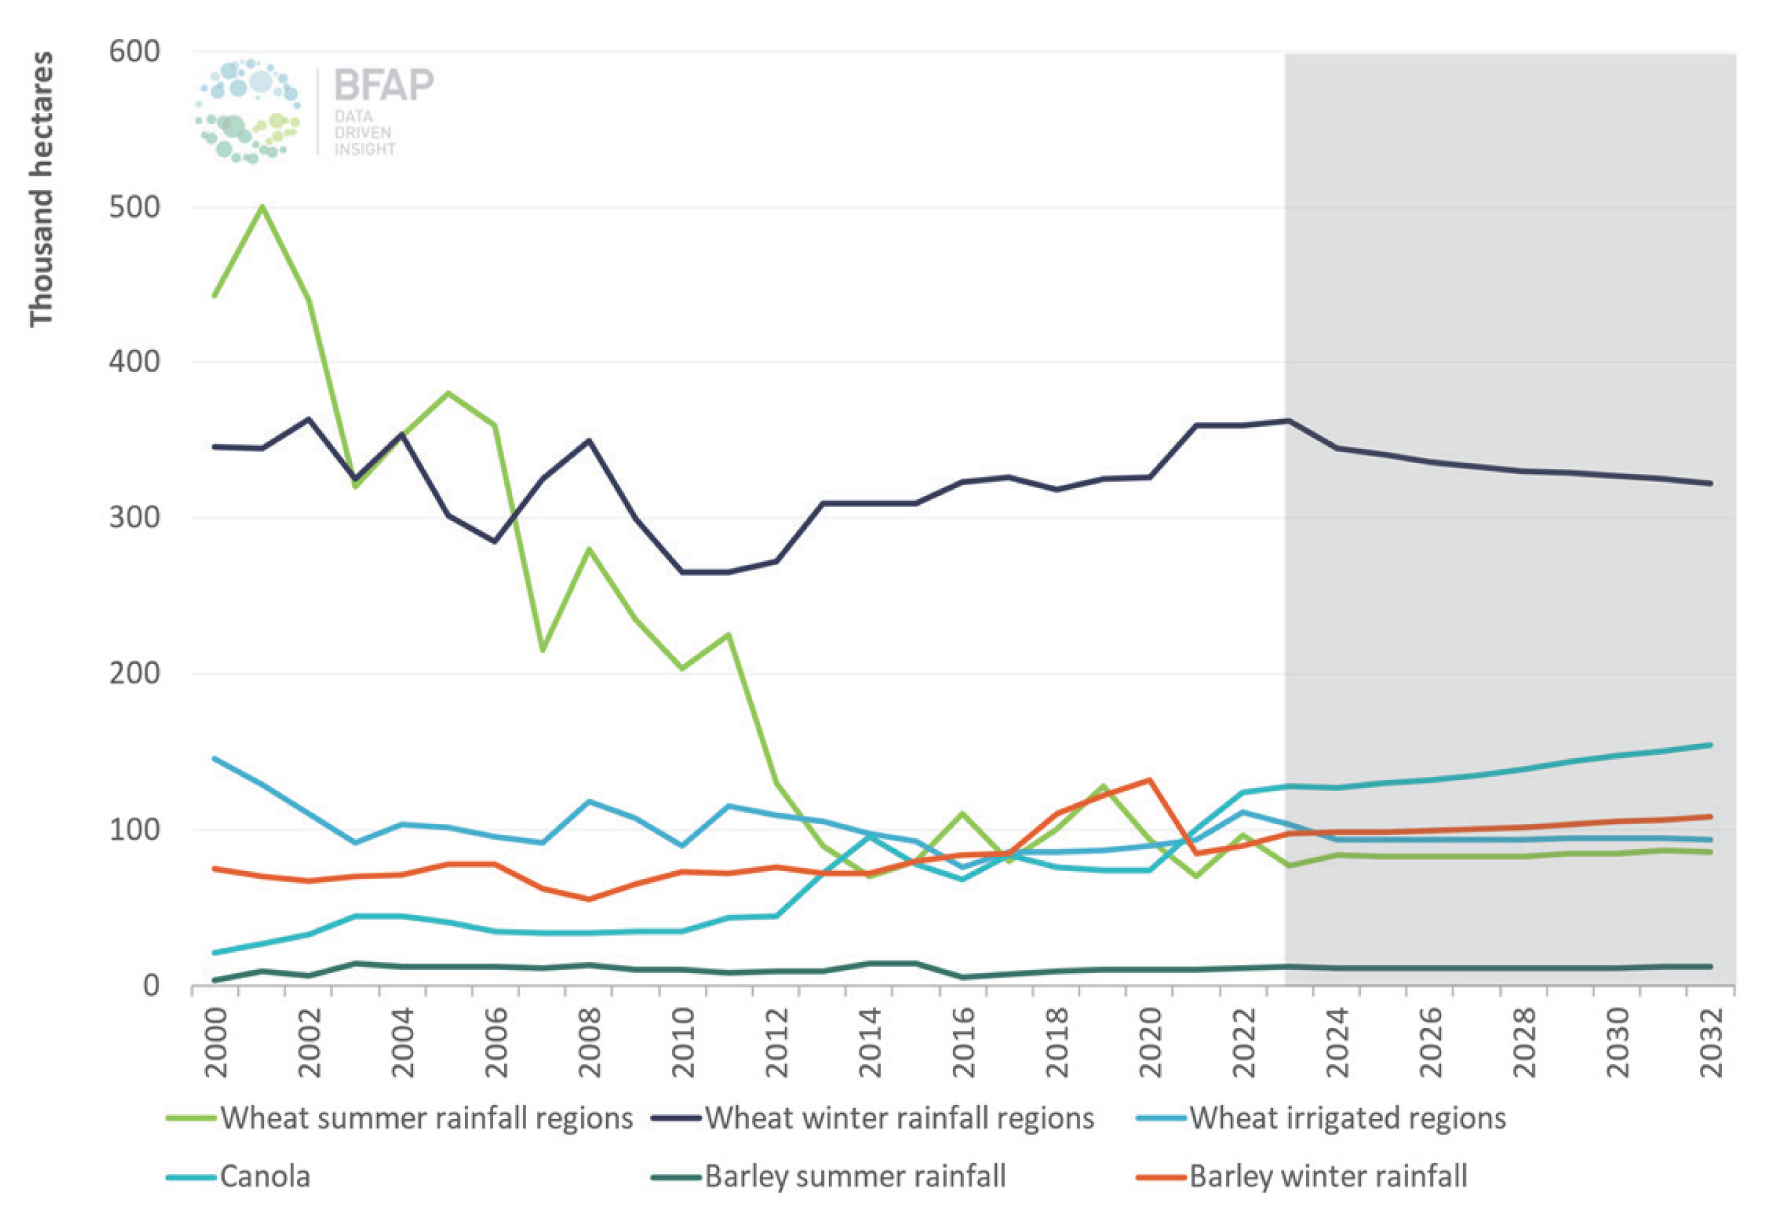
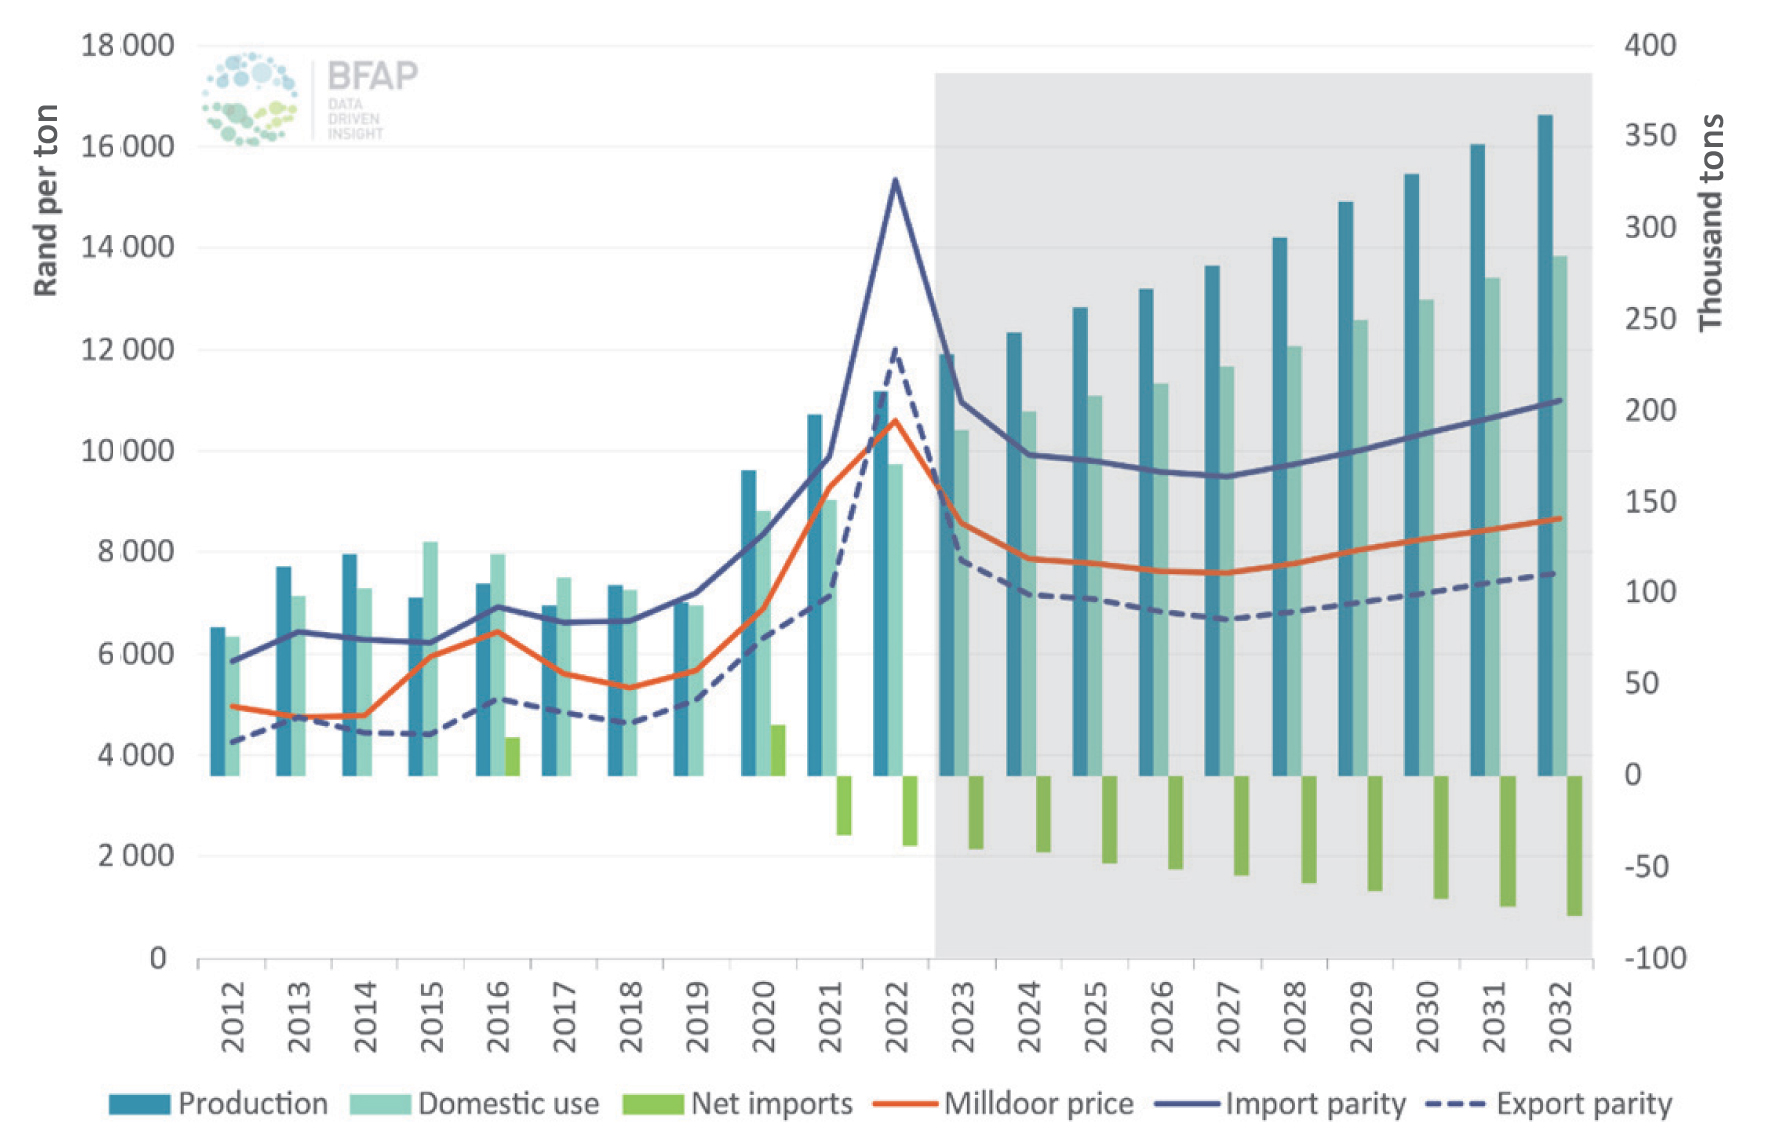
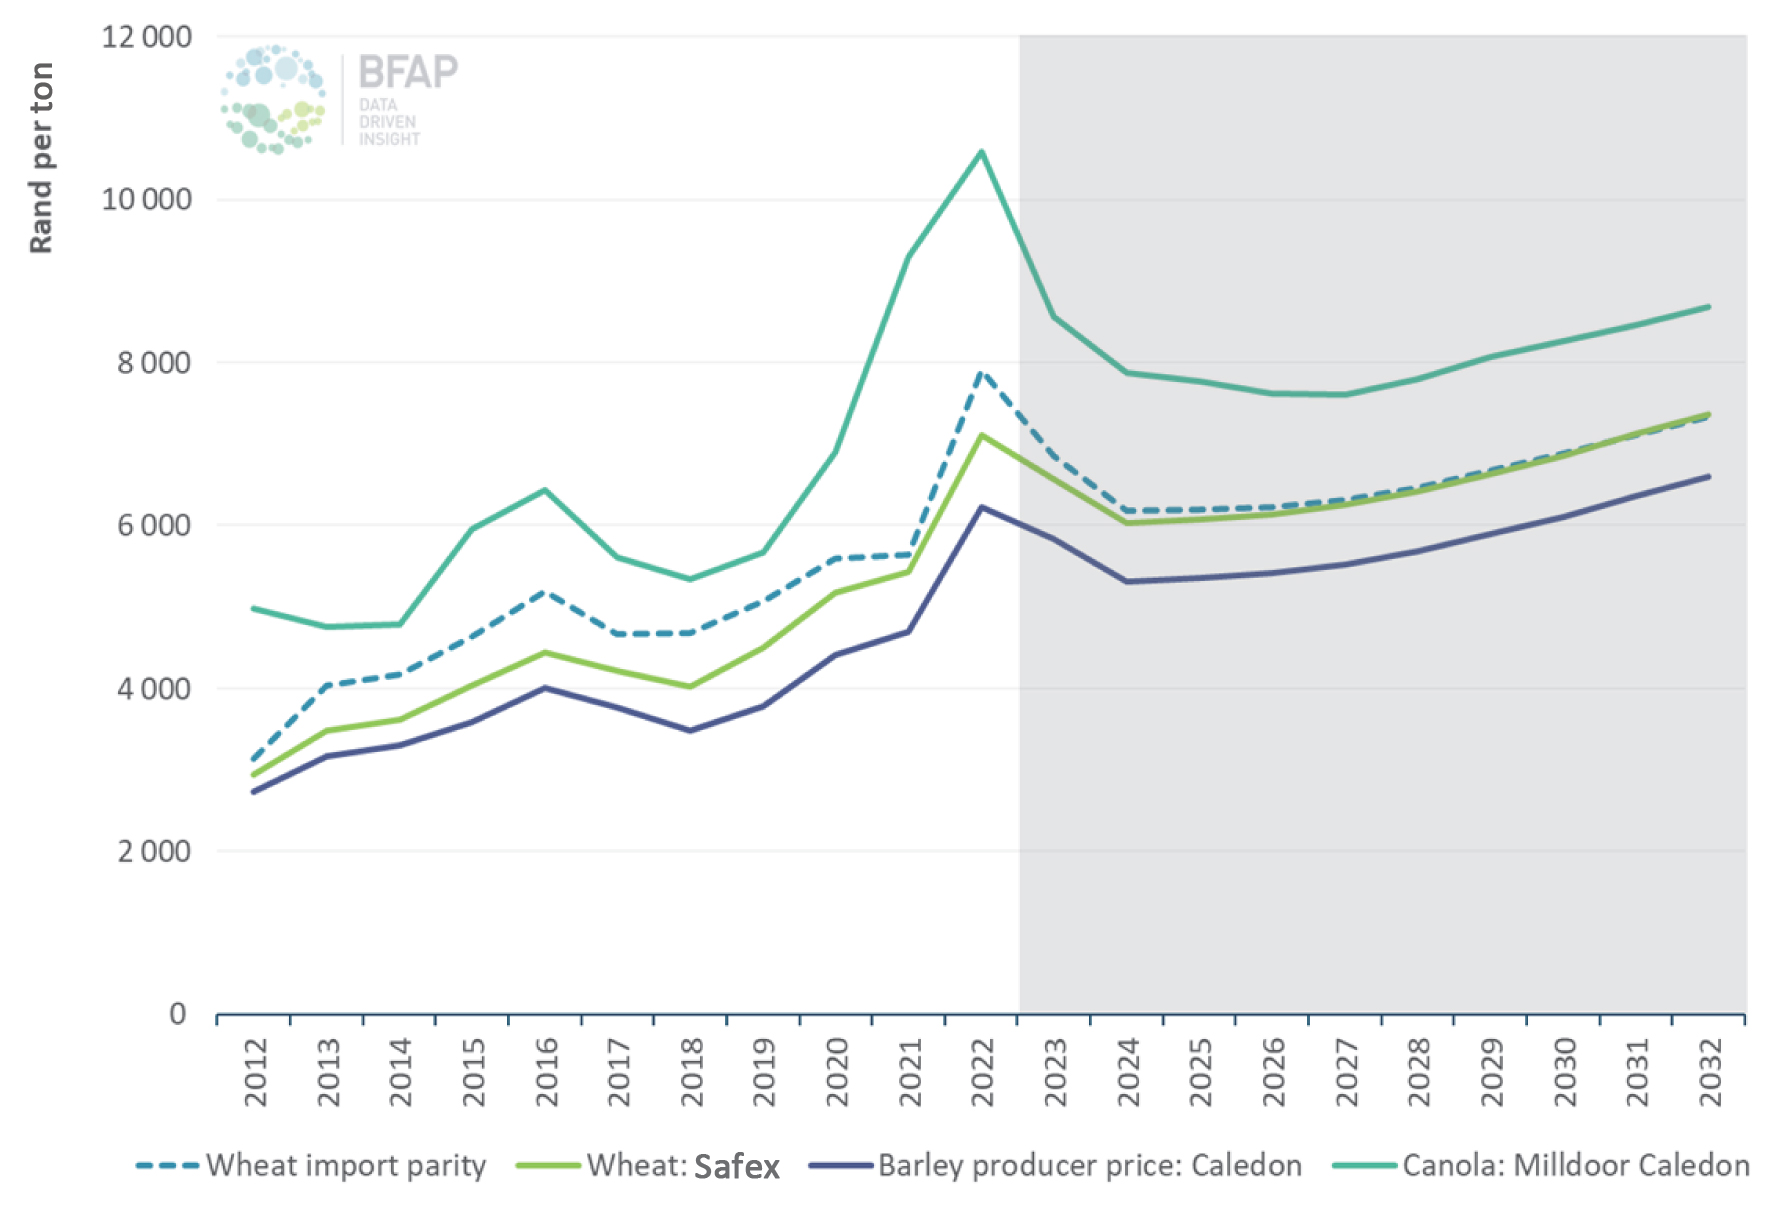
Graph 7 gives no surprises when showing the gross value of production for the winter crop, with wheat being much higher than barley and canola. The baseline expects that after robust performance in wheat, canola, and barley, the price will decrease to normal levels over the coming few years. In saying that, they also expect that input costs will not decrease in the same ratio, and this will affect profitability and area planted. Graph 8 shows through the forecasts that the area planted may decrease moving closer to 2032.
Focusing on canola, Graph 9 shows the production, consumption, trade, and price of canola for the period 2012 to 2032. Examining Graph 9, the first thing to note is the sharp increase in production from 2019 to 2020 and the continuous increase until 2032. Domestic use is projected to increase with production, but at a lower rate. It is also worth noting that while production and domestic use are projected to increase, South Africa’s dependence on importing canola is decreasing more and more with each passing year. Once again, from 2023 onward, the milldoor price is seen to mirror the movement of the import parity price. This decreasing dependency on canola imports is further shown when examining Graph 10 that shows the depiction of 2032. Graph 11 illustrates the domestic prices of the winter grains. Prices are expected to decrease until around 2026, where they start to increase on a steady upward trend until 2032.
What is important for grain producers looking at the baseline?
The 20th baseline report highlights both realities and actions that grain producers should take note off and act upon accordingly. By looking at realities that will influence the outlook, South Africa is facing numerous challenges that inhibit its competitiveness. Ports and logistics, service delivery challenges and animal health and biosecurity are all factors halting agricultural activities. This leads to South Africa’s agricultural performance coming under increasing pressure. The pressure comes from lagged exports of grain produce, the energy crisis adding significantly to capital and operational expenditure and the animal sector exhibiting quantity reductions. Despite the existence of various growth plans, such as the Agricultural and Agroprocessing Master Plan (AAMP), implementation to address prior mentioned challenges has been lacking.
From the baseline report a few decisive actions for field crop sectors were highlighted and grain producers should take note of these important points. South Africa is a net exporter of major crops and world prices are coming down, therefore both competitiveness and productivity will be critical for grain producers to remain profitable. Another important point highlighted was that strong performance in the sector over the past three years has enabled investment in technology that can optimise productivity. Together with using the technology available, grain producers should note that efficient registration of new products is critical to enable them to adopt to these new technologies. Lastly, the reality of port capacity and efficiency is increasingly challenging as export volumes grow.
Conclusion
In conclusion, BFAP has consistently highlighted key factors essential for grain producers and the entire agricultural value chain in South Africa. These include the necessity for a stable policy and investment environment, infrastructure development (covering electricity, roads and ports, and water), well-functioning municipalities, efficient producer support programmes, and effective state services. Therefore, the 2023 report serves as a call to action, urging decisive steps to address the challenges and ensure a sustainable future for the entire agriculture and food value chain, encompassing economic, environmental, and social aspects.


