agricultural economist,
Grain SA,
christiaan@grainsa.co.za
In 2017 a memorandum of understanding for the funding and management of this fertiliser and lime quality monitoring project was entered into by and between the then Department of Agriculture, Forestry and Fisheries, the fertilizer association of Southern Africa (Fertasa), Grain SA and the Sasol Agricultural Trust.
This project continued in 2022, with the aim to establish whether liming material and fertiliser quality are maintained according to the regulations of the Fertiliser Act (Act No. 36 of 1947) through random sampling of at least 140 fertilisers and 10 lime sources.
Of the 89 fertilisers that were sampled in 2022, 7% were deficient in one aspect and 8% in two of the quality parameters. Of the 81 nitrogen-containing fertilisers, 99% were compliant in respect of nitrogen (N). Sixty fertilisers contained phosphorus (P), of which 98% were compliant for P. Of the 50 potassium-containing fertilisers, 92% were compliant regarding potassium (K). A total of 46 fertilisers contained sulphur (S) with 93% compliancy, eleven contained calcium (Ca) with 91% compliancy and five contained magnesium (Mg) with 80% compliancy. Nine fertilisers contained one or more of the following nutrients: boron, copper, manganese and iron, all in compliant quantities. Thirty-five fertilisers contained zinc (Zn), of which 86% were compliant for Zn. The act stipulates that the total nutrient content (N + P + K) of a fertiliser should not deviate by more than 14 g/kg from the registered content. This was found in 70 fertilisers with 94% compliancy.
Results: fertilisers
Summary statistics on the number of fertilisers sampled, analysed, re-analysed, fertilisers with one or more deficiencies and the number of companies involved in 2022 are shown in Table 1. As indicated, 37% of fertilisers were sampled in the winter rainfall area and 63% in the summer rainfall area. Of the 89 fertilisers, 75 were analysed once, ten twice and four were analysed a third time.
One fertiliser mixture (3%) from the winter rainfall area was deficient in one nutrient. Twelve fertilisers (21%) were deficient in the summer rainfall area. Overall, six (7%) of these fertilisers were deficient in one nutrient or total nutrient content and seven (8%) in two nutrients or total nutrient content.
Results: liming and gypsum products
Liming products
Summary statistics on the number of lime and gypsum products sampled, analysed and the number of companies involved in 2022 are shown in Table 2. As indicated, 42% of lime samples were taken in the winter rainfall area and 58% in the summer rainfall area. Seven lime products were registered as dolomitic and the remainder as calcitic. One dolomitic and one calcitic lime were registered as microfine. The compliance of these lime products with the regulatory parameters are shown in Table 2.
Gypsum products
Table 3 shows that 36% of gypsum products were sourced in the winter rainfall area and 64% in the summer rainfall area. Regarding the physical quality of gypsum, the act stipulates that at least 90% of a product should pass through a 2 mm sieve and at least 50% through a 0,25 mm sieve. The chemical quality is determined by the Ca and S contents. The minimum Ca content is 180 g/kg and the minimum S content 120 g/kg.
The compliance of all gypsum products is also shown in Table 3. Less than 65% of these products met at least one of the two fineness requirements while 45% complied with the Ca content requirement. All gypsum products complied with the S content requirement. Only one gypsum product out of the eleven (9%), complied with all physical and chemical requirements.
 Interesting trends from 2017 to 2022
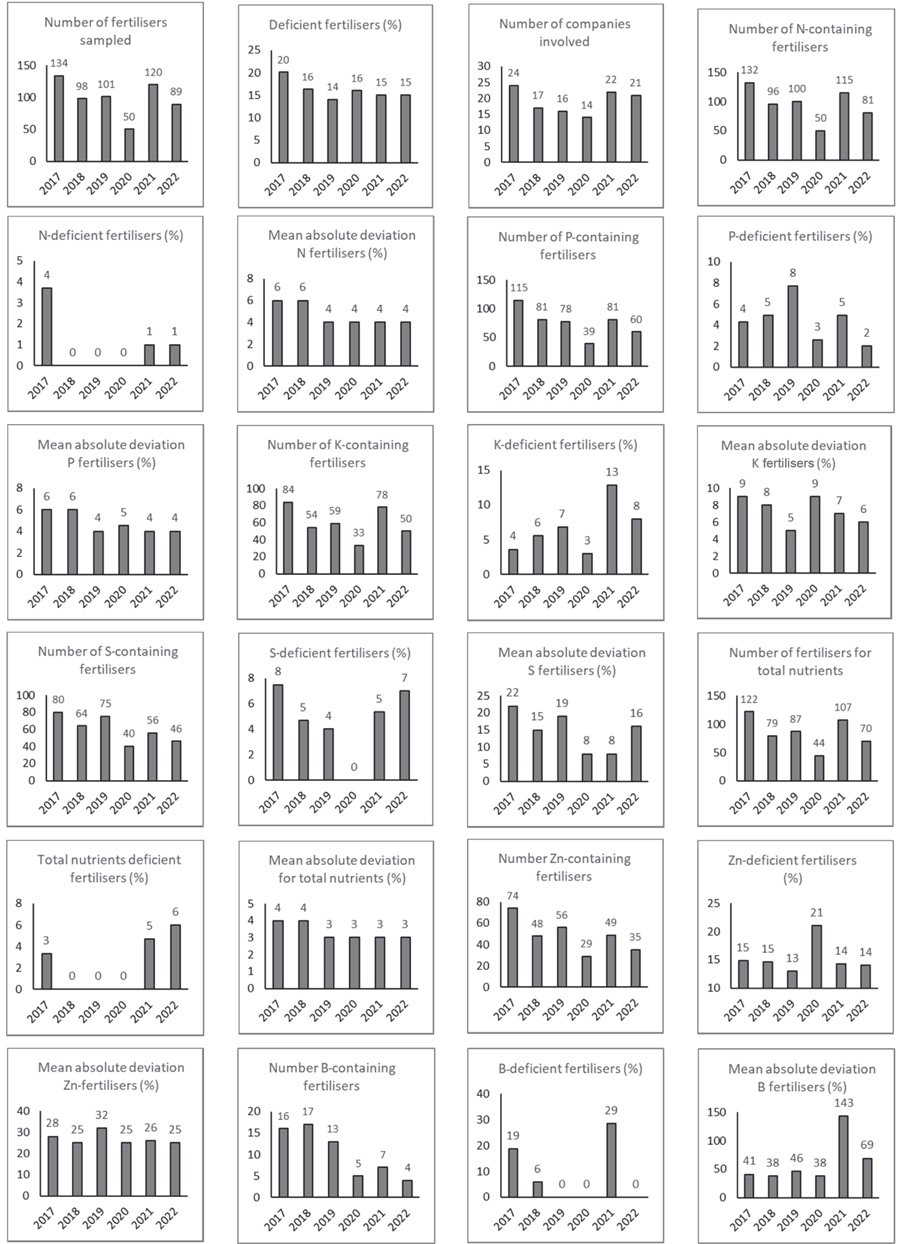
Some relevant statistics for the various fertilisers sampled from 2017 to 2022 are graphically displayed in Figure 1. Figures for copper, iron, molybdenum and manganese are not shown as only a few fertilisers contained these nutrients in some years and which were, since 2017, never deficient.
Note that the number of fertilisers sampled and number of companies involved varied over time. The number of fertilisers sampled from each company varied over time as well. Thus, assuming that the six investigations, each on its own, is a true reflection of the fertiliser quality of each year, the following can be stated:
- A total of 592 fertilisers were sampled from 2017 to 2022. The percentage of non-compliant fertilisers declined from 2017 to 2018 and then levelled out between 14% and 16%.
- Of the fertilisers sampled since 2017, 97% contained N. Of these fertilisers, 1% were non-compliant. Non-compliant fertilisers declined from a low 4% in 2017 to ≤1%over time.
- From 2017 to 2022, 77% of fertilisers contained P with 5% of them non-compliant. Excluding the 8% found in 2019, the portion non-compliant P fertilisers varied between 2% and 5% annually with no trend over time.
- In total, since 2017, 60% of fertilisers contained K and 7% of these fertilisers were non-compliant. Annual non-compliancy varied from 3% to 13% with an apparent increase over time.
- The total nutrient requirement applied to 86% of all fertilisers sampled from 2017 to 2022. Less than 3% of them were non-compliant with sporadic occurrence over time.
- S was a registered nutrient in 61% of fertilisers since 2017, with 5% of them non-compliant. The percentage non-compliancy varied between 0% and 8% annually with no particular trend over time.
Conclusions
Conclusion: fertilisers
Of the fertilisers sampled in 2022, 85% complied with all the quality requirements, in many cases with nutrient levels significantly above their registered contents. However, 15% of fertilisers were non-compliant in one or more aspects. Zn, K and S are notable as respectively 14%, 8% and 7% of fertilisers containing them were non-compliant. Furthermore, N, P and total nutrients were deficient in 6% or less of fertilisers containing them. Sixteen fertilisers contained either calcium or magnesium of which one was non-compliant. Few fertilisers contained copper, iron or manganese, which all were compliant.
From 2017 to 2018 the fraction of non-compliant fertilisers showed a significant decline and since then, levelled off between 14% to 16%. The mean absolute deviation of the nutrient content of some major nutrients namely N, P and total nutrients had a declining trend, levelling off from 2017 to 2022, while K, S, Ca and Mg are still declining.
Conclusion: lime and gypsum products
The physical quality of most lime products is substandard as less than 45% were compliant to either of the two sieve requirements, while none were compliant to both these requirements. The chemical quality of lime products was relatively better with 83% compliance with both the Mg content and CCE requirements.
Like lime, the physical quality of gypsum products was also substandard, as only 36% were compliant to both sieve requirements. The chemical quality of gypsum products is also substandard as only 45% were chemically compliant with both the Ca content and S content requirements.


