


Helga Ottermann, analyst: Value Chain Analytics Division, BFAP

Marion Delport, manager: Data
Science, BFAP

Dr Divan van
der Westhuizen, manager: Farm & Production Analytics Division, BFAP

Dr Dirk Strydom, Marketing, NAMPO
and Research
Coordination lead,
Grain SA
Data intensive farm management (DIFM) is a project in collaboration with various research institutes and industry stakeholders. The purpose of the project is to improve sustainability by utilising data in creative trial designs to find optimal profit given input variables.
The DIFM results for one maize and one soybean trial data set were analysed to determine the data-driven site-specific management recommendation for profit optimisation, using geographically weighted regressions (GWR) and general additive models (GAM). The identified management zones with their respective profit-maximising input rate recommendations and yield estimates were incorporated into the BFAP farm-level financial model. The farm structure that was used represents a typical, fairly large-scale, cash crop producer in the Free State region of South Africa, with its associated production system and corresponding input and overhead costs. Precision farming investment costs were used to calculate the farm’s financial impact of upgrading existing equipment to enable variable seeding and fertiliser application capabilities.
DIFM trial data and statistical analysis
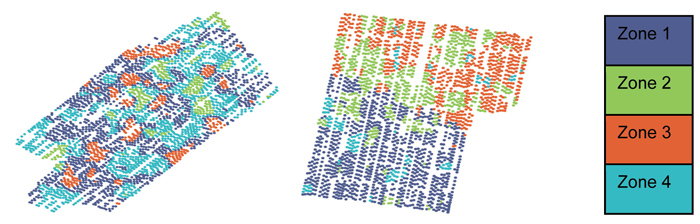
The trials that best corresponded with the identified typical farm production practices were selected for the study, as well as the trials with the best data quality regarding the response curves (input versus yield). The spatial datasets (more than a thousand combinations of yield and variable inputs per trial) were used to perform a geographically weighted regression to determine management zones in the field that have similar response curves. The profit-optimising input rates were determined for each management zone – that is the optimum seeding and fertiliser rates that should be applied per zone to obtain the highest profit, as opposed to one uniform application rate per field.
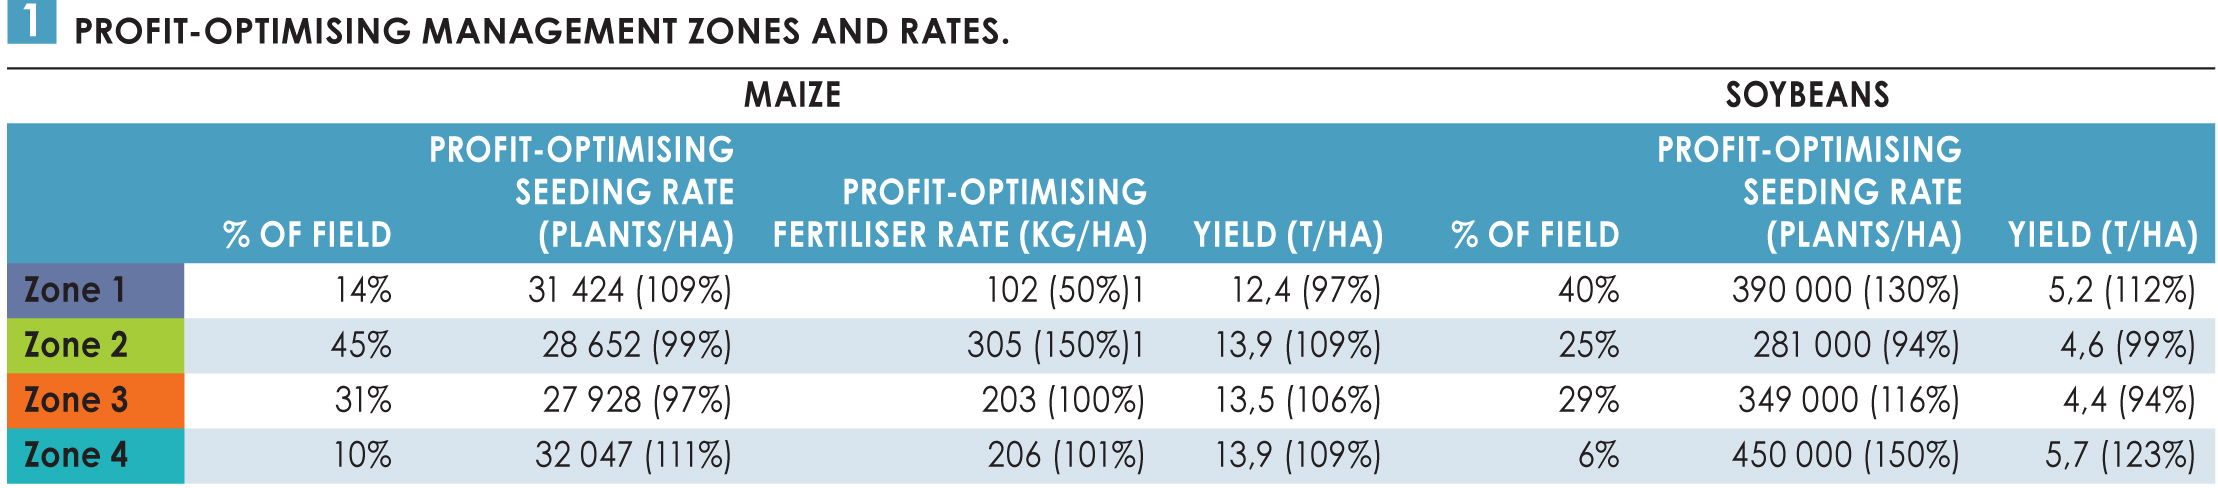
Table 1 illustrates the DIFM results for the selected trials given the climatic conditions for the 2020/2021 season. The values in brackets represent the percentage deviation of the zone’s optimum seeding rate, fertiliser rate and yield from the uniform status quo rates and yield. For example, an optimum profit for maize production in zone 1 will be generated through a marginally higher seeding rate (9% higher compared to the uniformed rate) and lower fertiliser rate (50% less) which is attributed to a lower yield compared to the field average. Traditionally one would think that higher application rates should result in higher yields. However, the analytics suggest that for this field and its associated weather conditions, the relationship between application rates (seed and fertiliser) and yield required to optimise profit, could differ for each zone (as is presented in the zone-specific profit optimising criteria in Table 1). Furthermore, in some zones, negative correlations between applied rates and yield were observed.
Typical farm-level financial model simulation
The typical Free State farm that was used in the DIFM analysis cultivates maize, soybean and sunflower on roughly 2 400 ha. In the modelling approach, the production system with its corresponding crop characteristics (area, yield, price and direct costs) is integrated within the financial structure of the farm (overhead costs, asset structure, liabilities and cost of debt). The integration of the technical and financial framework within the BFAP system of linked models allows for simulating potential future scenarios over an eight-year period with the objective to assess key financial indicators such as net farm income, cash flow and return on investment. For the purpose of this analysis, two versions of the same farm were created, one for the baseline (typical base farm) which assumes uniform averaged input application and yields; and a precision farming scenario where the DIFM results are incorporated into the modelling framework. For the scenario, maize and soybean production were categorised into four varying zones (yield, fertiliser and seed application) as indicated in Table 1.

Farm revenues were calculated by multiplying the farmgate price by the average regional yield. The precision farm yield was adjusted according to the four zones’ percentage yield differences (Table 1), while the typical base farm yield remained constant. The direct costs of the precision agriculture farm were assumed to be the same as the typical base farm costs, except for fertiliser and seed costs, where the application rates varied between the zones according to the DIFM data (see percentage differences from Table 1).
The farm financial simulation model also accounts for asset replacement, programmed in such a way that if sufficient cash is available and in line with the asset replacement strategy, a portion of farm vehicles, machinery and equipment will be replaced annually (for example, vehicles every five years and implements and machinery every seven years). For the precision agriculture farm, the asset structure was adjusted to account for precision technology (display, receiver, AutoTract™ universal 300, variable rate seed metering and fertiliser applicators and variable rate controllers). The capital investment that is required for this technology is assumed to be paid over a five-year medium-term loan (a 10% deposit was assumed) subject to annual principal payments and interest. The two farms can be summarised as follows:
- A typical base farm – a farm with a typical production system and standard replacement strategy of equipment depending on the availability of cash.
- A precision agriculture farm with technology – a farm that has invested in precision agriculture technology and thus utilises the advantage of variable rate application.
Analysis and results
Net farm gross margin
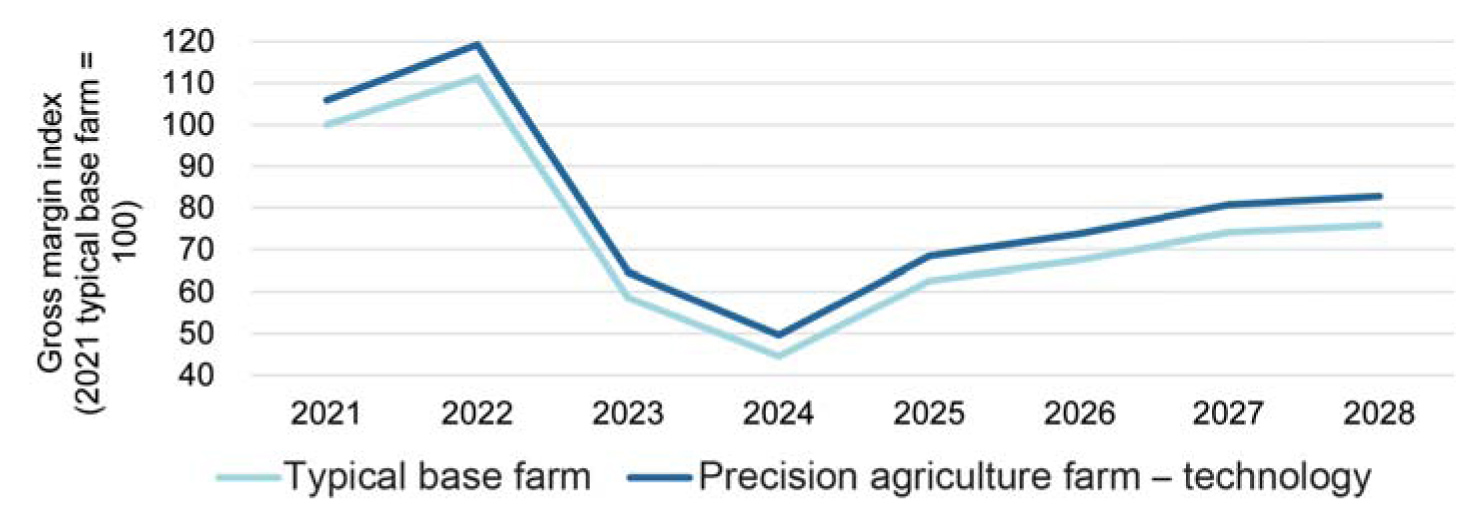
The results indicated that the precision farm realised a higher net farm gross margin compared to the typical base farm. (Net farm gross margin is calculated by subtracting direct and overhead costs from the revenue.) The additional farm gross margin per year ranged from R830 000 to R1,3 million. The total absolute gross margin benefit of the precision technology over the simulated eight years was R8,2 million. The net gain is mainly due to the weighted average yield of the precision farm being slightly higher than the typical base farm (approximately 0,36 t/ha for maize and 0,09 t/ha for soybeans) due to efficiency gains that result from managing the zones with precision technology and techniques. This yield increase can, however, differ from one season or field to the next, and a relative step change from typical production methods to precision methods still needs to be quantified. Furthermore, different weather conditions (a drier season) may result in larger variations between the different precision zones, which may contribute to larger input cost variations. Thus, conducting the DIFM trial over multiple years with different climatic conditions is crucial to reliably quantify the impact of variable rate management.
Return on investment
For the precision farm, it was assumed that equipment compatible with precision farming was already owned and that only the technology and software were required to perform variable rate application with the necessary data analytics to inform zone correlation attributes and management.
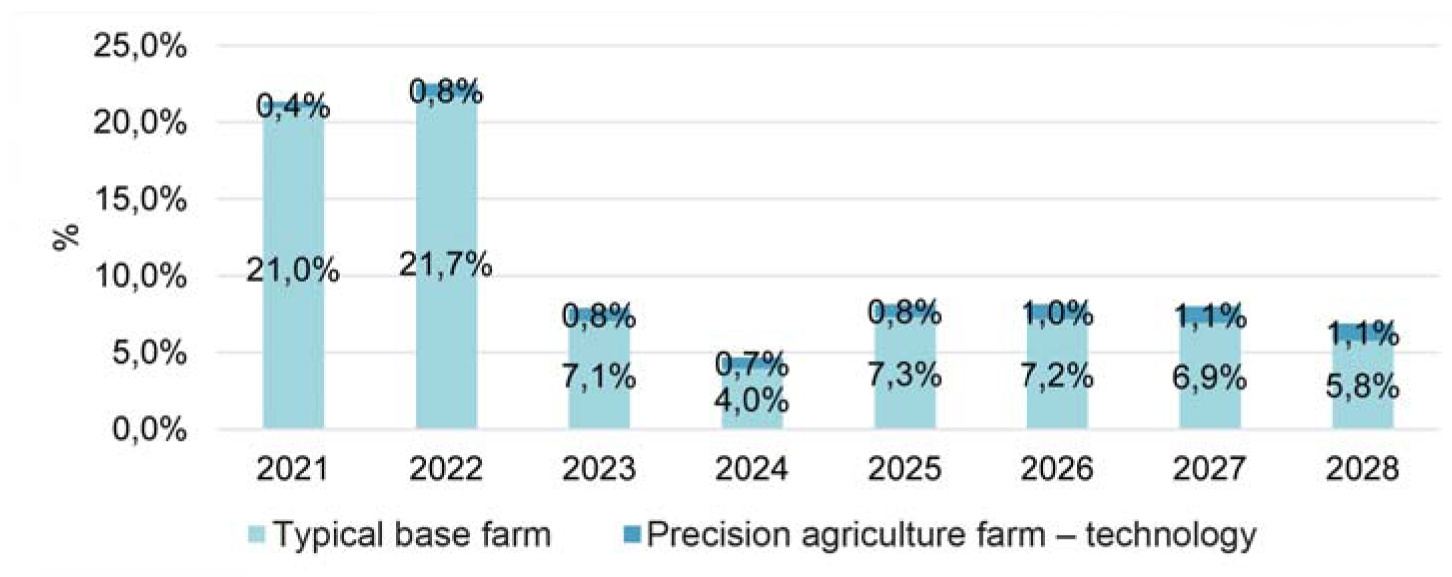
The return on assets (ROA) indicator is often a useful proxy to determine the performance of specific investments. The ROA is calculated by dividing the net farm income by the asset value (which includes the land, equipment, implements, machinery and vehicles). Graph 2 shows the ROA for investing in precision technology in combination with the required data analytics, which is between 0,38% and 1,10% higher compared to the typical base farm.
Although the precision agriculture ROA seems small, this percentage change is calculated over a large farm asset value which includes the value of land and fixed improvements. Graph 3 illustrates the return on investment (ROI), accounting only for the investment in precision technology. By 2027, the medium-term loan will be settled and only the benefit is realised going forward. Besides offering a higher ROI, precision farming also contributes to other benefits and risk mitigation elements such as improved planting and application accuracy, reduced downtime and the ability to improve the management of planting windows. These factors, however, are complex to quantify.
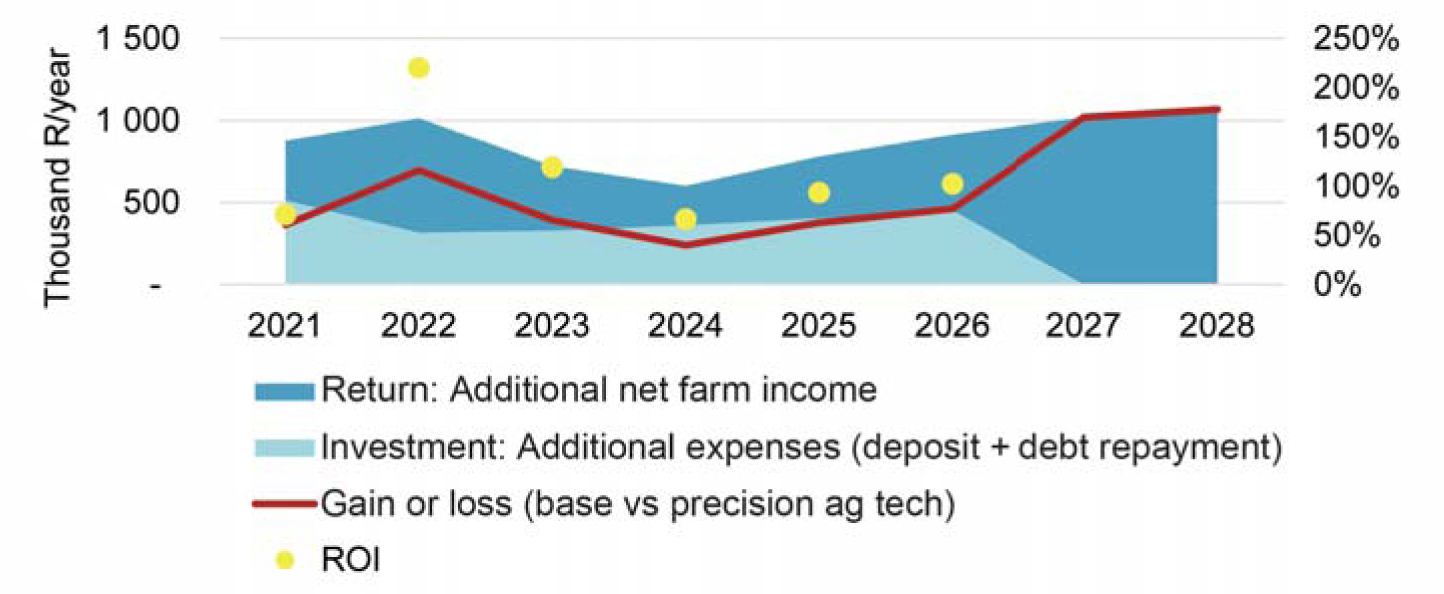
The investment in precision technology in combination with data-intensive farming techniques are expected to render an additional net farm income of R6,8 million over eight years. This return is substantially higher compared to the initial cost of investing in the technology (estimated at R2 million). The investment yields a 295% ROI as well as a 54% internal rate of return over eight years, and can potentially be paid off within one high-yielding year. However, the analysis is limited as it assumes that the same conditions and responses will be experienced in future as experienced on the 2021 DIFM trial field. Hence, it is crucial to emphasise the importance of future studies to obtain more data for the development of more reliable and representative results over multiple years and conditions (weather, soil composition, cultivars).
Despite these benefits, the reality is that not all farms are equipped with precision-compatible equipment and have the ability to conduct data-intensive analytics to inform variable rate approaches. The initial capital investment for these farms will be much higher compared to investing in the software only (additional equipment includes tractors, sprayers, combines, planters and fertiliser distributors). For these farms that require the capital investment in the equipment itself, ROI will still be positive (36% over an eight-year period). However, a negative internal rate of return over the period will materialise.
![]() The research was sponsored by John Deere
The research was sponsored by John Deere
These results are specific to a field/location with its physical and chemical soil composition, the cultivar planted as well as the climatic outcomes of the specific production season such as temperature, rainfall and timing of rainfall. (The 2020/2021 season was characterised by well-timed above average rainfall.) Results from another year can look completely different.


