 Dr Dirk Strydom, Marketing, NAMPO and Research Coordination lead, Grain SA
 Helga Otterman, analyst: Value Chain Analytics division, BFAP
Data Intensive Farm Management (DIFM) is a project in collaboration with various research institutes and industry stakeholders. The purpose of the project is to improve sustainability by utilising data in creative trial designs to find optimal profit given input variables.
This project is already in its third year with two years of data sets completed for 2020 and 2021. In order to obtain more information and data, the project was expanded from 2020, which only included trials in the Free State and Mpumalanga, to additional trials in KwaZulu-Natal and the North West Province.
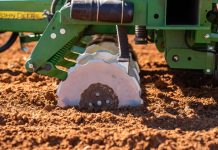
With variable rate planting equipment and precision technology, trials were designed, executed and analysed for each plot for the 2020 and 2021 seasons. For each trial, a close collaboration with the producers was established to make the execution as seamless as possible and to capture the producers’ very valuable insights when analysing the data.
Once starting to work with the data, one soon realises there are lots of different trials that can be done with a lot of different variables that can be considered. In terms of the two concluded years, the focus was specifically on seeding rate and nitrogen application in the maize trials; and seeding rate in the soybean trials. If more information was available on variables, for example soil characteristics and soil depth, it was also utilised for additional processing and analysis.
Results summary from the trials
When looking at the results, it is important to remember that the trials were conducted in only a few fields and that they cannot be generalised across the regions. The results rather illustrate interesting points that need to be investigated further. One must realise that both seasons were exceptionally wet with above average rainfall – they can both be regarded as outlier seasons in terms of normal production years.
In all of the maize trials it was observed that the optimal seeding rate and the optimal nitrogen application were higher than the status quo applied by the producers. Optimal is defined as profit maximising, given the in-season input and output prices. The increases in profits ranged between R1 692/ha and R3 749/ha depending on the region and – very importantly – also the season. The optimal seeding rates differ from region to region. In the Free State, the trials suggest an optimum seeding rate of between 26 000 plants/ha and 28 500 plants/ha, and in Mpumalanga and KwaZulu-Natal trials suggest between 60 000 plants/ha and 65 000 plants/ha.
The trial design gives researchers the opportunity to have as many data points in a field as possible – close to 3 000 data points in a 50-ha field trial. However, to obtain more out of the data, more seasons are needed. In terms of the Hennenman trial, one can see that there is a difference in the optimal seeding and fertiliser application rate between the two years, which speaks to the climatic differences. However, the gap between the status quo and the optimal range is smaller than the difference between the two optimal ranges, especially on the seeding rates.
In terms of soybeans, it was interesting to observe that there are different nodes of optimal returns. For example, in the KwaZulu-Natal trial, the optimal seeding rates were achieved at 190 000 seeds/ha, 270 000 seeds/ha and 350 000 seeds/ha. This also differs from region to region; the lowest optimal seeding rate was in the Free State and the highest in North West.
What was learned from this research, is that one can find optimal points for maximum profit. The interesting thing is that these optimal points are not always at the highest yield levels, but there is a relationship between input usage and output gains. These were exceptional years and longer data sets are required to find more accurate results. The trials and experiments start to become more difficult when the fields have contours. Finally, as is well known, the different cultivars also have a large impact.

 What more can be gained from the data?
With the data from the trial design, researchers can also utilise soil characteristics to do some correlation analyses (Figure 1). This will provide additional information that was always a bit of a mystery.


In conclusion, the use of new technology to do trials can assist producers to be more efficient and to utilise variable soils better with the right cultivars and applications. However, the same analysis also needs to be done in dryer years to start identifying risk curves.
Further research questions that this project may assist in solving, include the following:
Develop response curves on the following:
- Maize yield versus planting density and nitrogen/fertiliser application.
- Soybean yield versus planting density and ‘with plant’ fertiliser application and pre-plant fertiliser application.
Profit maximising planting density and nitrogen/fertiliser application:
- Take risk factors into account: bivariate price x yield distribution and risk management range/solution.
- Increase profit optimisation.
Feasibility of site-specific management: Quantify the advantage of site-specific in-field management based on:
- Soil-available water, soil depth, soil type.
- Can DIFM trial data be used to identify in-field zones for precision management? Are there clear correlations with soil variables such as soil depth and water-holding capacity to delineate these zones?
