ARC-Small Grain,
Bethlehem
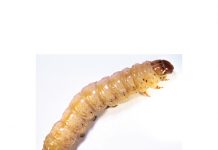
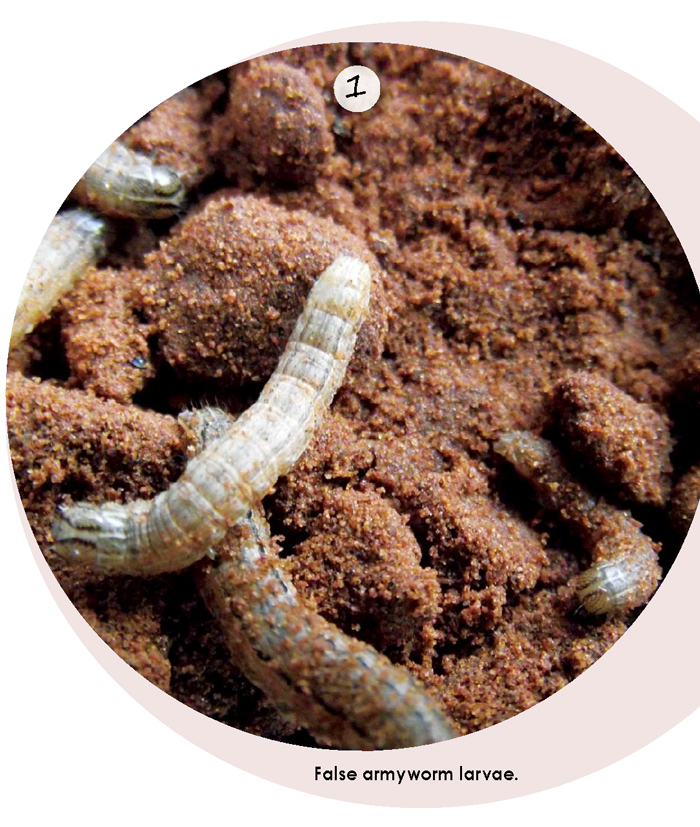
During 2019 the first results of the false armyworm forecasting model became available and clarity regarding the population growth started to develop. This insect is a sporadic pest on barley, wheat, maize and sorghum (Photo 1). Although normally not important, serious outbreaks like on barley in 2010, could cause considerable damage.
Overlapping generations
From the previous years’ results, it seems as if temperatures are warm enough for the larvae and pupae to survive in the soil through the winter. Life cycles starting as larvae during April, May and June will slowly develop through winter and the new moths will hatch during September and October, when temperatures start to rise (Graph 1). Depending on the number of moths present during this three-month period, many new moth populations could hatch within days from each other that could cause high numbers of eggs to be laid (Graph 1).
Fermenting dead grass stimulates oviposition
Since dry conditions occur during September and October in most of the irrigation areas, green plants and wet conditions are restricted to centre-pivot irrigation systems. Female moths are especially attracted towards the smell of fermenting dead grass, which are normally found on the edges of irrigated fields.
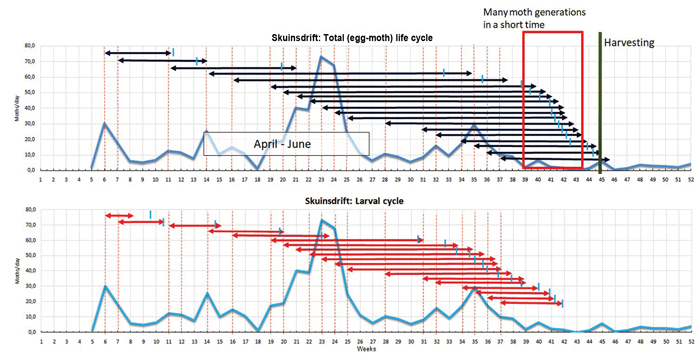
The moth cycles, which start in September or October, will normally be completed within three to four weeks (Graph 1). The second life cycle could then be the one that causes the problems. During this time the plants are already drying off and rotting dead plant material on the soil could attract female moths to lay eggs. Larvae from these eggs will then damage the crop depending on the numbers present. The knowledge gained through this research enables us to forecast when possible outbreaks may occur.
Current situation
Halfway through the current year of monitoring, we are now able to forecast in which areas outbreaks may occur. Specific areas where outbreaks are possible include Skuinsdrift, Koedoeskop, Beestekraal, Magogong, Luckhoff, Modderrivier and Douglas.
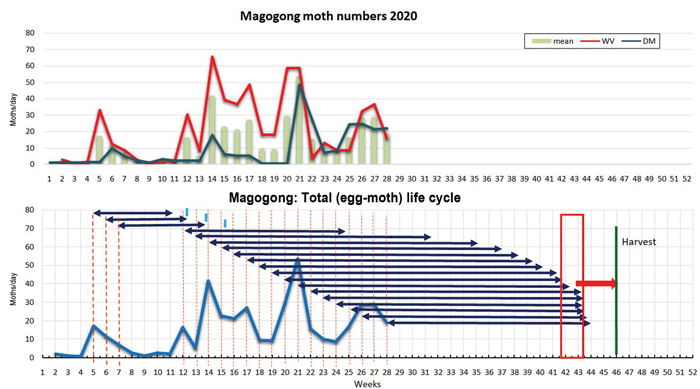
 Magogong is used as an example here, while the rest of the areas’ data can be followed on the ARC-Small Grain website by scanning or clicking the QR code.
For Magogong it is clear that about seven moth cycles will emerge between week 41 and 43 (October), which is about six weeks before harvest (Graph 2). Depending on the weather and the number of moths present, an ideal outbreak situation with accompanying damage could arise just before the crop is harvested. Producers should be on the alert for possible infestations and act accordingly.
Western Cape
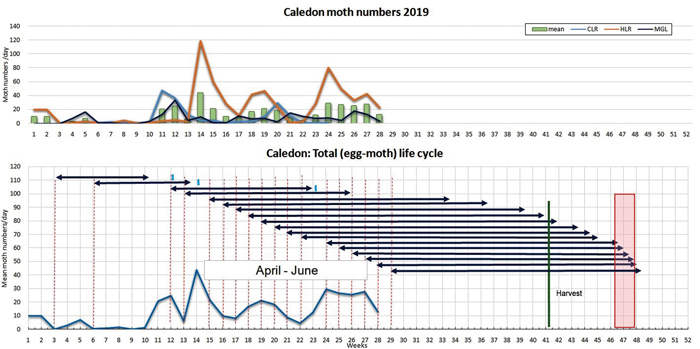
In the Western Cape false armyworm follows a different pattern. During 2019 extremely high moth activity was noted during May. Larvae were found to infest oats and in some places newly emerging wheat and barley plants. During the current season few moths flew in May and did not pose a threat to emerging grains (Graph 3). It is also clear that the offspring from the April to June flight peaks, which are causing overlapping generations, will not influence the crop, because they are forecasted to appear well after the harvesting date. From the previous years’ experience, it seems that their appearance earlier in the season is more important for this area than later in the grain-growing season.

Conclusion
From the data collected it is clear that – depending on the local weather conditions – potential outbreaks may occur in several of the irrigation areas. Producers should therefore keep an eye on their barley crops – specifically during October – and act accordingly if necessary. Regular updates on the situation will be communicated by ARC-Small Grain. We would like to acknowledge AB InBev for financial support and thank all producers involved in the project for their ongoing cooperation.
For further information contact Dr Goddy Prinsloo at Prinsloogj@arc.agric.za or 082 875 3401.


