


Department of
Plant Sciences, Plant Pathology, University
of the Free State

Mariana van Deventer,
postgraduate researcher, Plant Pathology,
Stellenbosch University

Dr Diane Mostert,
chief technical officer, Plant Pathology,
Stellenbosch University
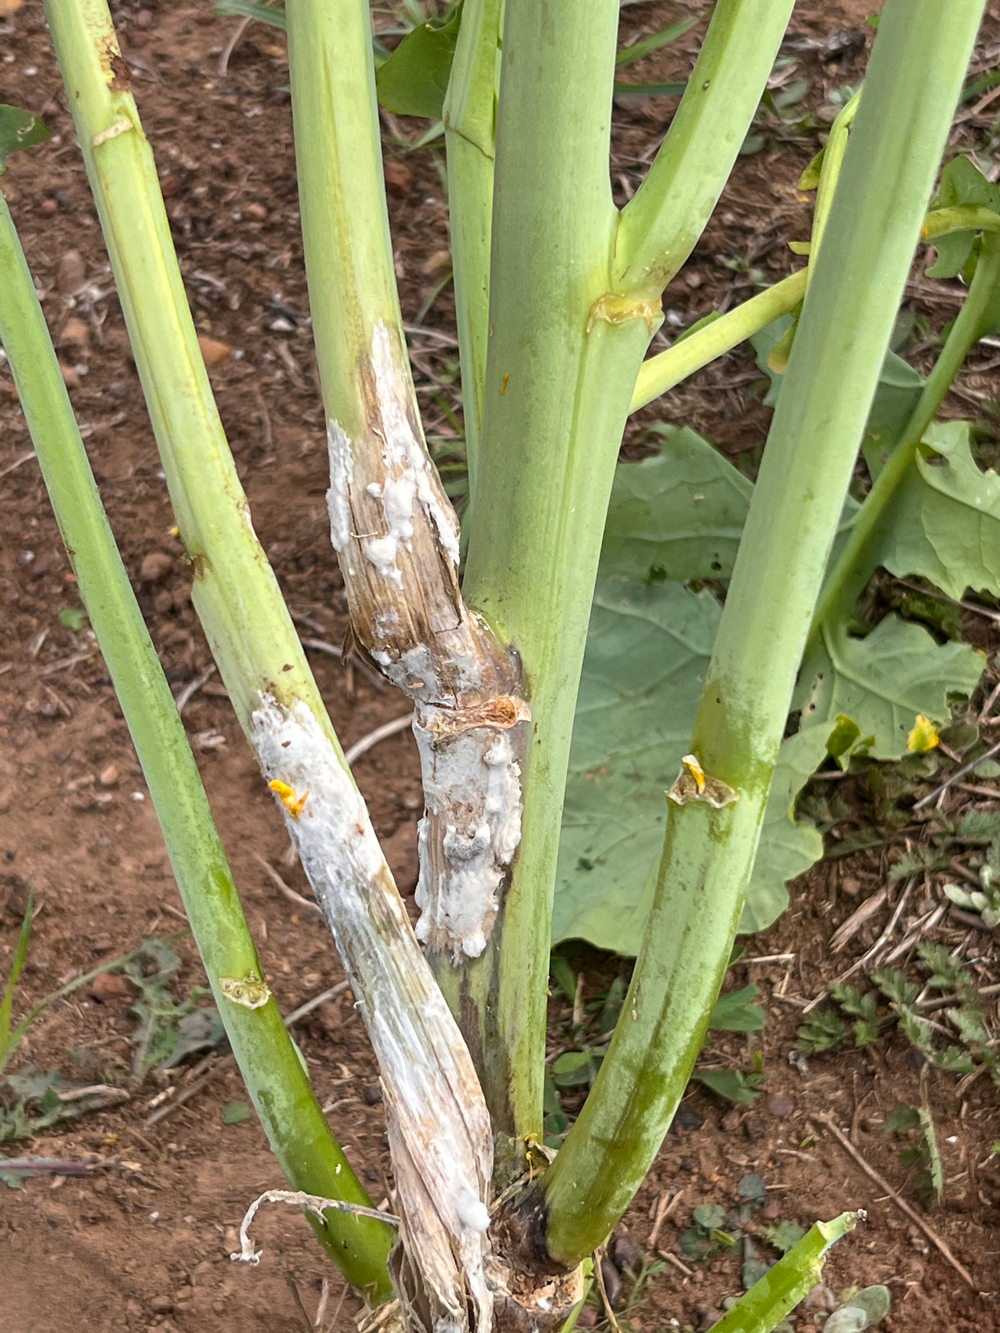
Sclerotinia stem rot of canola (Photo 1) remains one of the most sporadic diseases encountered in local production. Field observations show that incidence can be negligible in some years, yet under the right conditions, the disease can quickly develop into epidemic outbreaks and cause substantial losses. Because of this unpredictability, canola is also the crop for which the most forecasting models have been developed worldwide for Sclerotinia sclerotiorum.
There is now a minimum of 14 different forecasting models for S. sclerotiorum on canola, more than for any other host crop. Dry bean, lettuce, carrot, and soybean follow behind, but none comes close to the level of attention canola has received. This global focus reflects decades of work in Canada, as well as in several European countries, including Denmark, Germany, and Sweden.
Together, these models offer valuable insights into how Sclerotinia behaves, what drives disease risk, and how producers elsewhere utilise epidemiology to make more informed management decisions. These insights are highly relevant for South African producers as our canola industry continues to strengthen and expand. In this article, we will explore the foundations of three forecasting models, considering the different questions they pose, the biological and environmental signals they rely on, and what their underlying logic can teach us.
Three broad types of models are commonly used in plant pathology. The first are rule-based models, which rely on expert knowledge, research findings, and recurring patterns or thresholds observed across seasons. These models function like a weighted checklist. If certain criteria are met, such as recent rainfall, a dense canopy, or a history of Sclerotinia stem rot, each factor is assigned a point value, and the combined score provides an indication of risk.
The second category involves empirical models, which are built from statistical or mathematical analyses of field data or controlled experiments. These models identify which variables, such as temperature, rainfall, soil moisture, or flowering dates, are most strongly associated with outbreaks, fitting equations to these relationships to generate predictions. Because empirical models are heavily influenced by the data used to develop them, they often perform very well in the specific region where they were created but may not be reliable elsewhere unless they are re-evaluated and validated under new conditions.
Mechanistic models form the third type, simulating biological processes and focusing on the biology of the disease itself. They describe how sclerotia germinate, how apothecia form, and how infection progresses under different conditions, using mathematical relationships to translate these processes into predicted disease risk. Each model type prompts different questions, but together they help us understand how Sclerotinia behaves and how we can anticipate periods of risk.
Across the different forecasting systems developed worldwide, researchers tend to ask three core questions when building a model for Sclerotinia. The first question is: What is the likelihood that apothecia will develop? This focuses on the early stage of the pathogen’s life cycle, where sclerotia in the soil germinate and produce apothecia that release airborne ascospores. The second question is to what extent petals are becoming infested with ascospores. In canola, petals provide the nutrient source and point of entry for infection, so the level of petal infestation is a strong indicator of inoculum pressure during flowering. The third question is what the likelihood is that the disease will actually develop in the crop. This requires combining weather conditions, canopy microclimate, and crop stage with the pathogen’s ability to infect, to determine whether infection is likely and how it may progress. These three questions reflect different biological processes in the Sclerotinia life cycle, which means each requires a distinct modelling approach and contributes uniquely to our understanding and assessment of risk.
Different forecasting models
One of the earliest forecasting approaches originated from Denmark, where researchers monitored Sclerotinia stem rot nationwide using dedicated depots of sclerotia – places in fields where sclerotia were intentionally placed in the soil – or fields with a known history of Sclerotinia stem rot. These depots were checked regularly for apothecia formation, and a simple threshold emerged from the data: when more than 26% of the sclerotia produced apothecia, a measurable risk of yield reduction was present. Scouts would record apothecia development at the depots, and if that threshold was crossed, all crops within a 15-km radius were advised to be sprayed (Buchwaldt, 1986).
This early warning system makes an important point clear: forecasting operates on two levels. Researchers work with the model, evaluating thresholds, biological signals, and the relationships that drive disease development. Producers, in turn, receive an action-ready output that distils this analysis into a format that supports timely decisions. This is where the forecast begins to shift towards what we call a decision-support system, a tool that interprets the risk estimate and helps producers decide how to respond.
However, even where a decision-support system exists, the ultimate decision still rests with the producer, who must weigh model outputs against their own knowledge of their fields and management priorities.
The next type of model was developed in Canada for canola and was co-created with producers (Turkington et al., 1991 doi.org/10.1080/07060669109500965). This work was conducted over a five-year period, from 1985 to 1990, and involved extensive participation from producers. Around 600 producers were approached, and approximately 250 responded, providing petal samples throughout the flowering period. In some seasons, samples came from more than 200 commercial fields.
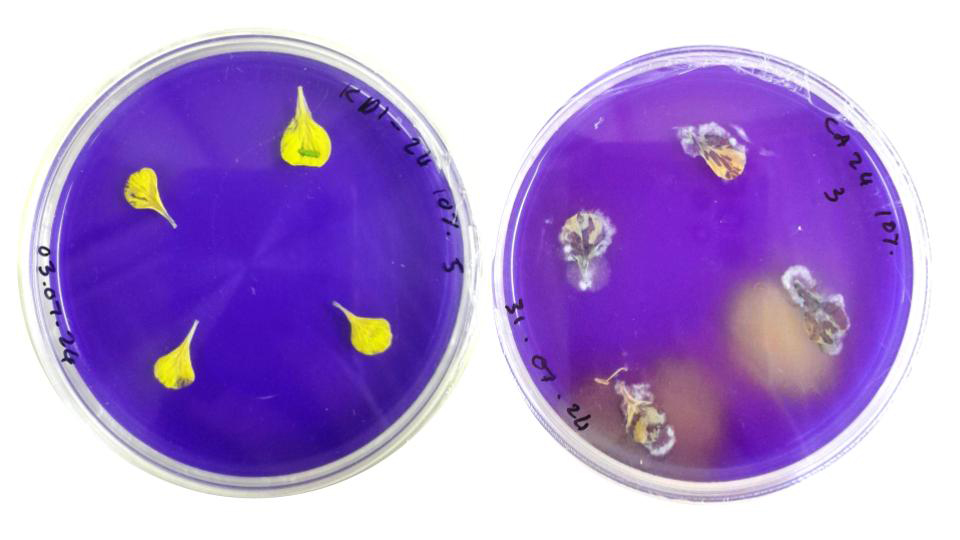
Producers were requested to collect canola petals or send them in for processing for analysis in the laboratory, where petals were plated onto a selective medium to determine whether they were infected with S. sclerotiorum (Figure 1). Where the medium turned yellow, it indicated that ascospores had colonised the petal, and the proportion of petals showing this colour change was used to calculate the percentage of petal infestation.
Using this petal infestation information, researchers were able to link the proportion of infected petals to disease outcomes in the field and establish clear thresholds for low, moderate, and high risk. For example, when petal infestation was less than 45%, the expected disease incidence was below 20%, indicating a low risk. When petal infestation reached 90% or more, the expected disease incidence increased to over 40%, considered a high risk.
The resulting system functioned much like a traffic-light robot: green for low risk, orange for moderate risk, and red for high risk, helping producers decide whether spraying was worthwhile based on expected disease pressure and their own production costs.
Another model example is SkleroPro (Koch et al., 2007; doi.org/10.1094/PHYTO-97-9-1186), a mechanistic forecasting model specifically designed for German canola production, where flowering stages and the presence of apothecia in the field are key factors in estimating risk and determining an intervention. From the outset, the design of SkleroPro integrated both the biological processes of the disease and the economic elements that influence a producer’s decision to spray. It takes into account how sclerotia germinate, how apothecia develop, and the conditions needed for infection, but it also incorporates expected yield, produce price, and the cost of applying a fungicide.
The outcome is a straightforward recommendation: yes or no to spray. In this way, the model directly links the underlying forecasting science to a decision-support system that producers can utilise.
SkleroPro was originally published in 2007 and has been recently updated in 2025 to enhance its predictive accuracy (Krause et al., 2025; doi.org/10.1002/ps.70166). In the updated version, researchers examined how optimal temperatures for infection and relative humidity thresholds could be refined to enhance the model’s performance. As with all forecasting systems, it is essential to consider how often a model overestimates or underestimates disease prevalence. Overestimation occurs when the model predicts a higher incidence of disease than is actually present, prompting a reaction that is not necessary. Underestimation occurs when the model predicts a lower disease pressure than actually occurs in reality, meaning no action is taken when it should have been taken. SkleroPro tends to overestimate more often than underestimate, and approximately 30% of cases fall into this category.
Even so, it remains a notable advancement in mechanistic forecasting and continues to perform well overall. Because it was developed for German conditions, SkleroPro would still need to be evaluated and adapted for use in other regions. Forecasting tools such as this work best when they complement, rather than replace the practical knowledge producers bring to their own cropping systems.
Forecasting models
Forecasting models are powerful tools for Sclerotinia because they support more precise and well-timed intervention decisions, especially around fungicide applications, where efficiency and economic returns are crucial. They bring together years of biological research, field observations, and environmental data to help us understand a disease where risk can differ greatly between seasons. Models are especially valuable when producers have real options for responding to the risk that is forecasted, whether through fungicide application, adjusting fungicide timing, or simply preparing for a higher level of vigilance during flowering. In many ways, Sclerotinia fits this scenario perfectly: its life cycle is well-studied, the economic consequences can be substantial, and there are clear windows where intervention can make a difference.
These models require extensive data collection across seasons, robust sampling, careful laboratory work, and mathematical expertise to ensure that the identified relationships genuinely reflect what happens in producers’ fields. Large datasets must be cleaned, validated, and analysed, and each step demands significant time, manpower, and scientific rigour. The outcome, a simple risk signal, a yes-or-no spray recommendation, or a percentage risk threshold, may appear straightforward, but behind that simplicity lies years of coordinated effort.
Early steps towards this are already underway through research led by Mariana van Deventer and supervised by Dr Lisa Rothmann (University of the Free State), Dr Diane Mostert and Dr André van der Merwe at Stellenbosch University, working with Lizette Nowers from the Western Cape Department of Agriculture. The work draws on three years of data on airborne ascospores, petal infestation, and field disease incidence from canola production in the Southern Cape.
If you would like to read more about the petal infestation work, see ‘Tracking the invisible suspect: Airborne ascospore detection and monitoring of Sclerotinia stem rot of canola’ in Oilseeds Focus, March 2025.
We are now exploring whether this foundational data can support the development of a forecasting tool specifically tailored to South African conditions. Any future tool would work in conjunction with field experience. Forecasting will not replace field knowledge, but it can reinforce it, providing producers with another layer of confidence when working with a disease that remains highly unpredictable.
Click here to access the article in the Oilseed Focus, March 2025 edition.


