


Helga Ottermann,
analyst, BFAP

Karen Truter, PhD can-didate, Stellenbosch University; BFAP
consultant

Prof Pieter Swanepoel,
Department of Agronomy, Stellenbosch University

Prof Ferdi Meyer,
managing director, BFAP

Dr Divan van der
Westhuizen, manager: Farm and Production Analytics, BFAP

Dr Stephano Haarhoff,
extraordinary lecturer, Stellenbosch University
Fertilisers are crucial for improving soil fertility and maintaining agricultural productivity, especially in nutrient-limited soils commonly found in key grain-production regions of South Africa. The South African fertiliser industry is largely influenced by global trade dynamics, supply challenges, local agricultural needs, and environmental factors, all of which directly impact on-farm practices and profitability.
Local agriculture is highly dependent on fertiliser imports and requires adaptable strategies to mitigate the consequent high crop production costs and environmental challenges. Therefore, understanding fertiliser consumption patterns and adopting sustainable practices are essential to boost farm-level profitability while minimising long-term environmental impact.
South African fertiliser trade
Fertiliser trade is primarily influenced by global market trends and domestic demand for crop production. In 2023, the value of imports was $824 million, following a 20-year peak in 2022 that exceeded $1,5 billion. South Africa primarily imports fertilisers from Saudi Arabia (urea and MAP), Russia (MAP, urea, and KCL), Qatar, China, Germany, and Oman.
Between 2001 and 2023, South Africa’s fertiliser export values were highly volatile, peaking at $662 million in 2022, while the highest export volumes were recorded in 2015. These fluctuations largely mirrored global commodity price trends, which spiked during key events such as the 2008 biofuel mandates, the 2013 US drought, and the 2022 Russia-Ukraine conflict. Most exports were destined for neighbouring countries, with Zambia, Zimbabwe, Namibia, Botswana, and Eswatini together accounting for 78% of export value.
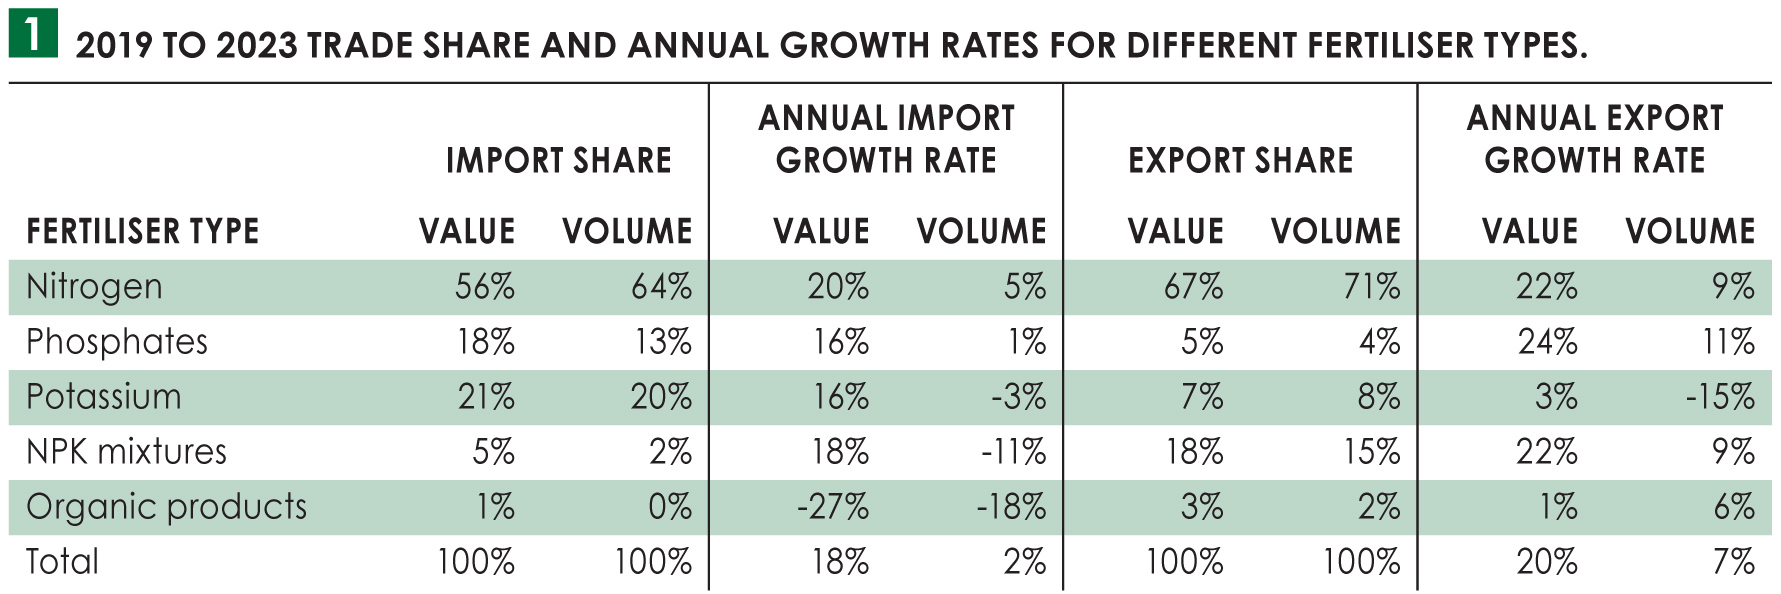
Table 1 illustrates the average share of fertiliser imports and exports by value and volume from 2019 to 2023, along with their growth rates. During this period, nitrogen (N) fertiliser products dominated imports, making up 56% of total import value and 64% of import volume, followed by potassium (K) and phosphorus (P). NPK mixtures and organic fertilisers only account for a small share of South Africa’s imports. The total value of imports increased at an average annual rate of 18% between 2019 and 2023, while total import volumes grew modestly by 2% per year. Notably, global prices for nitrogen- and phosphorus-based fertilisers increased significantly over this period, driven by supply challenges in response to geopolitical tensions, supply chain disruptions, and the COVID-19 pandemic.
From 2019 to 2023, nitrogen-based fertilisers accounted for the largest share of exports by volume (71%), followed by NPK blends, potassium, phosphorus, and organic products. Phosphorus exports recorded the fastest growth, with average annual increases of 24% in value and 11% in volume. In contrast, potassium export volumes declined slightly despite a modest increase in value. Both nitrogen and NPK mixtures indicated annual growth rates of 22% in value and 9% volume.
 Local fertiliser consumption
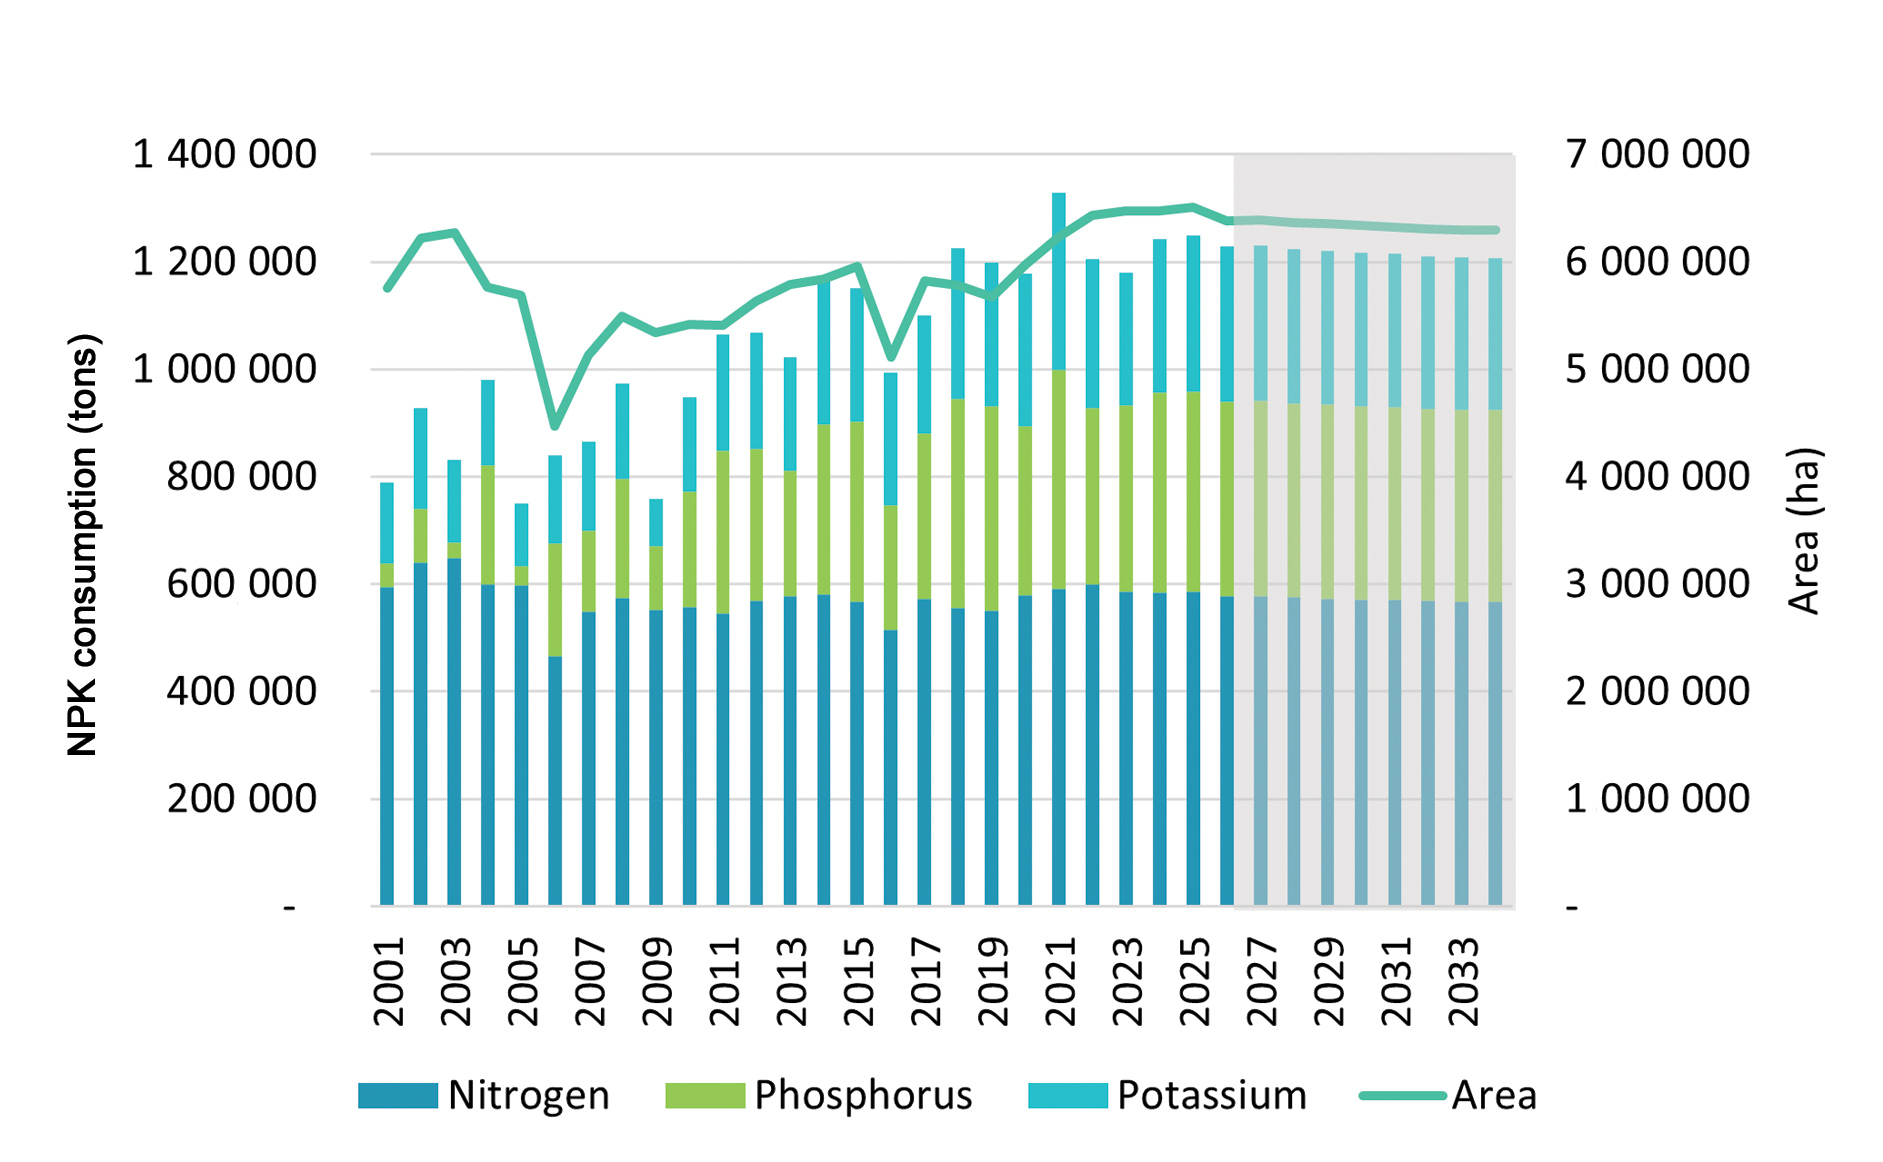
The Bureau for Food and Agricultural Policy (BFAP) in collaboration with Stellenbosch University conducted a study to determine the total fertiliser consumption in South Africa (Figure 1). To estimate NPK consumption, nutrient application rates (kg/ha) were multiplied by crop area. Given nitrogen’s direct yield effect, it was assumed that nitrogen application rates per hectare remained constant over time. However, phosphorus and potassium applications for field crops and pastures vary by location, production practices, soil characteristics, and farm profitability. Constant application rates could therefore not be assumed. Instead, local phosphorus and potassium supply was estimated by adding local production and imports, and then subtracting exports. The local supply was then allocated proportionally across the included field crops and pastures, while phosphorus and potassium application rates for horticulture were held constant. It was assumed that no fertiliser stocks were carried over, thus, local demand for phosphorus and potassium was adjusted downwards in years with lower supply and upwards in years with higher supply. Finally, future NPK consumption was projected by multiplying BFAP’s projected crop area by the average NPK application rates from the past five years (2019 to 2023).
Consumption per fertiliser nutrient
Over the past two decades, consumption patterns of nitrogen, phosphorus, and potassium have diverged notably. Nitrogen use showed relative minor fluctuations – it peaked at 648 000 tons in 2003, then declined by 28% to 466 750 tons in 2006 due to reduced cultivated area. From 2007 onwards, nitrogen consumption stabilised at around 560 000 tons annually, with only modest average annual growth of 0,3% through 2024.
In contrast, both phosphorus and potassium consumption grew significantly. Between 2004 and 2024, agricultural phosphorus use increased by an average of 6,3% per year, while potassium use rose by 4,4% annually. This trend reflects changing cropping patterns and evolving fertiliser requirements. Overall, the total area under crop production (including field crops, horticulture, and pastures) expanded from 5,76 million ha in 2001 to 6,48 million ha by 2024. With this shift, the area planted with major cereals (such as maize, wheat, and barley) declined by around 900 000 ha, from 4 million to 3,1 million ha. Meanwhile, oilseed cultivation, primarily soybeans and canola, increased by 1,1 million ha. Oilseeds, especially soybeans, require higher levels of phosphorus and potassium, and as legumes, they contribute to soil nitrogen through biological nitrogen fixation, reducing the need for inorganic nitrogen fertilisers in subsequent seasons (Salvagiotti et al., 2021). Additionally, the increase in phosphorus and potassium fertiliser consumption over the past two decades can be linked to greater awareness of soil corrections and nutrient management, as well as fluctuating weather conditions and farm-level profitability.
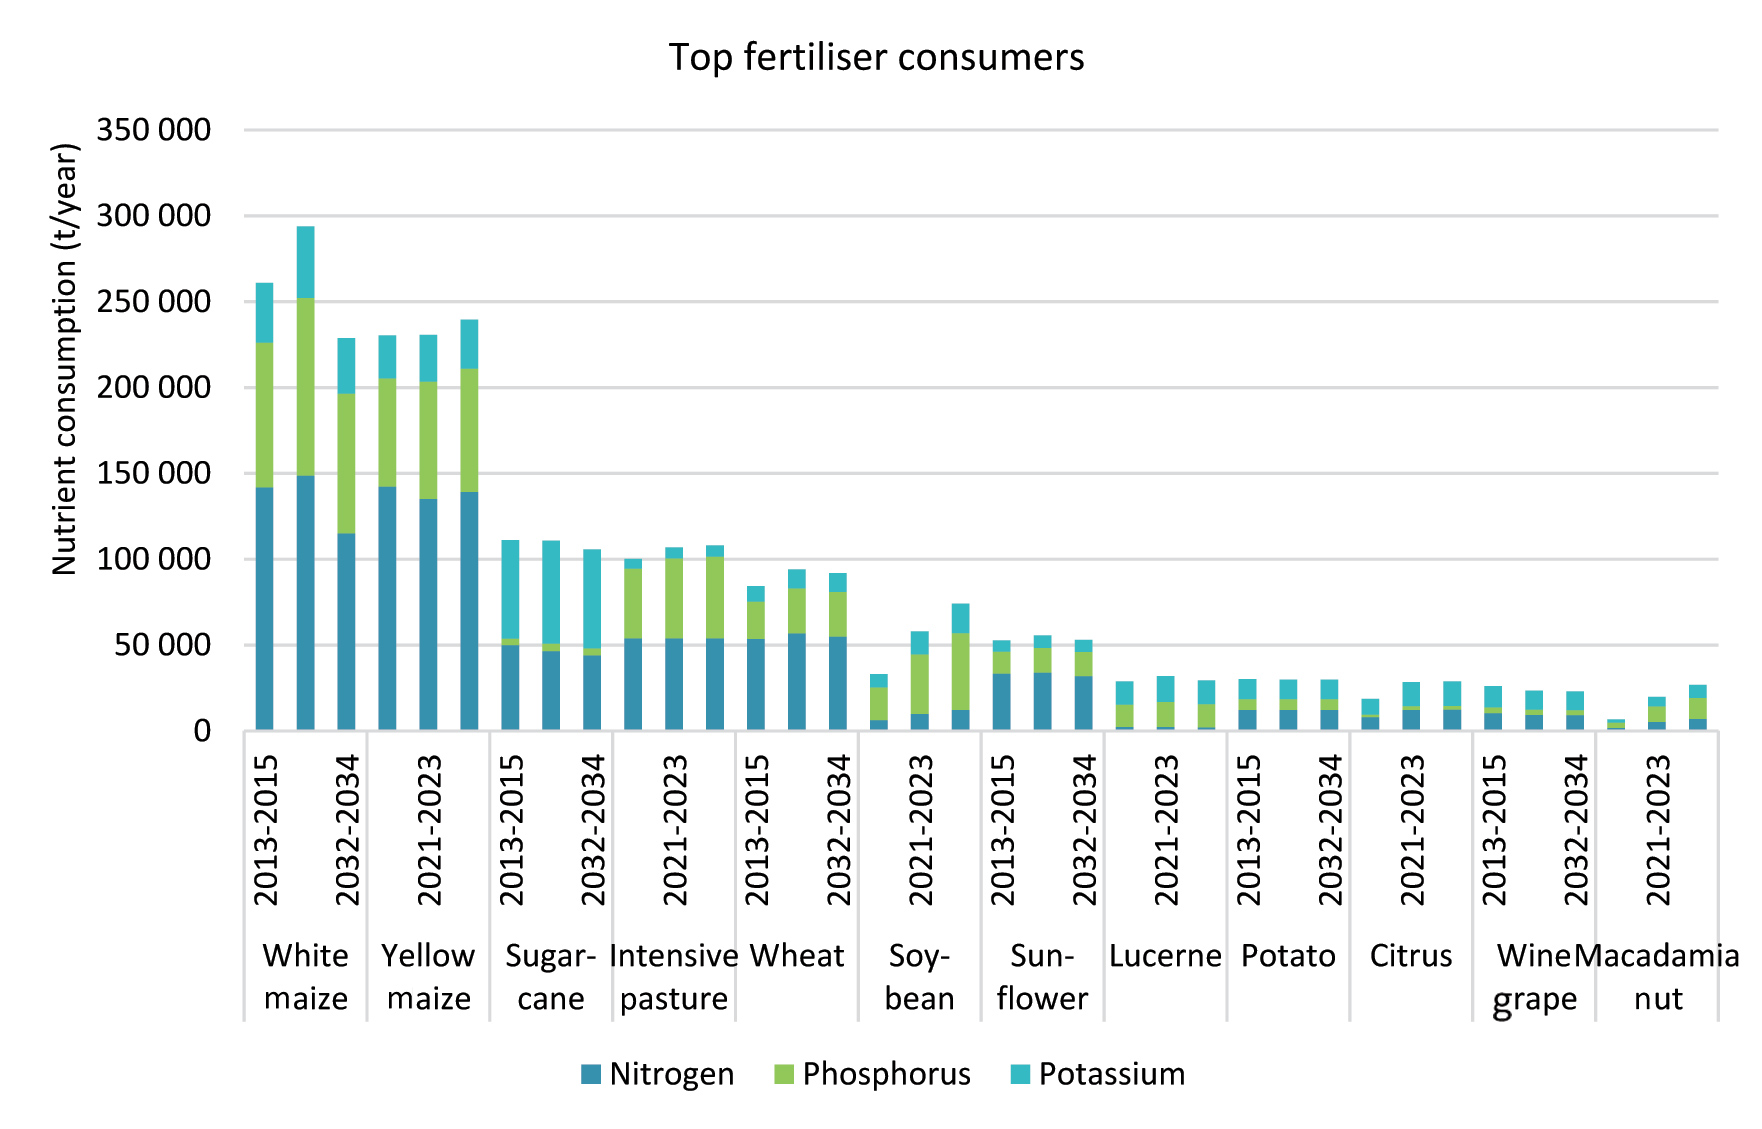
Figure 2 illustrates that most NPK fertilisers are applied to maize, sugarcane, and intensive pastures for dairy production. Overall, total consumption showed a modest increase from 2013-2015 to 2021-2023.
Field crops
The field crop sector has consistently dominated fertiliser consumption, accounting for about 73% of total NPK fertiliser use over the past decade. Among field crops, soybeans and canola have shown the fastest growth in NPK fertiliser consumption, driven by a sharp increase in production area. This expansion was primarily driven by substantial investments in soybean crushing plants aimed at replacing imported soybean meal and soybean oil with locally produced products. Additional support came from seed companies, technology providers, and producers adopting improved agronomic practices.
Horticultural
Over the past decade, the horticultural sector accounted for approximately 15% of annual NPK fertiliser consumption and experienced a strong growth rate of 24% from 2013 – 2015 to 2021 – 2023. This reflects a growing focus on high-value crop production. Some horticultural products saw even faster expansion. For example, macadamia nut production increased by 195% during the same period, with an additional 35% growth projected between 2021 – 2023 to 2032 – 2034 (Figure 2).
Pastures
The remaining 12% of total NPK fertilisers are applied annually to pastures, primarily supporting intensive pasture systems that produce high biomass yields and enhancing profitability of pasture-based dairy farms across the Western Cape, Eastern Cape, and KwaZulu-Natal provinces (Galloway et al., 2024). Unlike the trends in field crops and horticulture, NPK use in pastures has remained relatively stable over the past decade (Figure 2), indicating limited expansion or investment in pasture fertilisation for future production systems.
Projected fertiliser consumption
Looking ahead, several scenarios could affect fertiliser consumption. Under BFAP’s Baseline projections, the rapid expansion in soybean hectares is expected to slow down, despite some continued substitution of maize with soybeans. Maize hectares are projected to decline slightly as marginal production areas struggle to compete in the global market amid slow economic growth and downward price pressure. However, if economic growth improves both locally and globally, fertiliser use could increase again, following trends seen over the past two decades. Additionally, fertiliser use in the horticultural sector is expected to rise as more horticultural trees reach production maturity, increasing their fertiliser demand.
Acknowledgements
The authors wish to express their sincere gratitude to the Protein Research Foundation (PRF) and the Oilseeds Advisory Committee/Oil and Protein Seeds Development Trust (OAC/OPDT) for funding this project. They also thank the Fertilizer Association of South Africa (Fertasa) for providing valuable data and contributing critically to the interpretation of results. Furthermore, the authors acknowledge the support and insights received from industry partners and various academic institutions who generously shared data and expertise.


