


Karen Truter, PhD candi-date, Stellenbosch Univer-sity; BFAP consultant

Marion Delport,
manager: Data Science and Systems Integration, BFAP; research fellow: Agricultural Economics, Stellenbosch University

Henja Glas, data science intern, BFAP

Prof Ferdi Meyer,
managing director, BFAP

Prof Pieter Swanepoel, Department of Agronomy, Stellenbosch University
The South African agricultural landscape is undergoing a technological transformation. Technologies such as auto-steer systems, yield monitors, and variable rate applicators for lime, seed, and fertiliser are becoming increasingly accessible. These tools not only promise improved productivity and profitability but also generate valuable data that can transform decision-making on the farm.
However, the extent to which these technologies are adopted and utilised varies. While some producers have fully integrated precision agriculture into their operations, others acknowledge challenges such as limited knowledge, technical support, or confidence in interpreting the data.
To better understand this evolving landscape, a national survey was conducted by Stellenbosch University’s Agronomy Department and the Bureau for Food and Agricultural Policy (BFAP), to assess the adoption of precision agricultural technologies within South Africa’s field crop sector. This article explores key findings from the survey, highlighting prevailing trends, barriers to adoption, and potential pathways to support broader integration of precision agriculture.
Survey methodology
The survey employed a structured questionnaire which was distributed nationwide via Grain SA’s communication channels. It was designed to explore the level of understanding and adoption of precision agriculture across different age groups and farm sizes.
Participation was voluntary and anonymous, with the target audience being field crop producers. The questionnaire investigated the types of technologies used, data collection methods, and adoption of tools such as yield monitors and variable rate application systems. It is important to note that the adoption rates reported in this study may not fully reflect the broader farming population and may be skewed towards more progressive adopters. More background, additional results, and a more detailed discussion can also be found in the published article (Truter et al., 2025).
What we found
Adoption rates by age and farm size
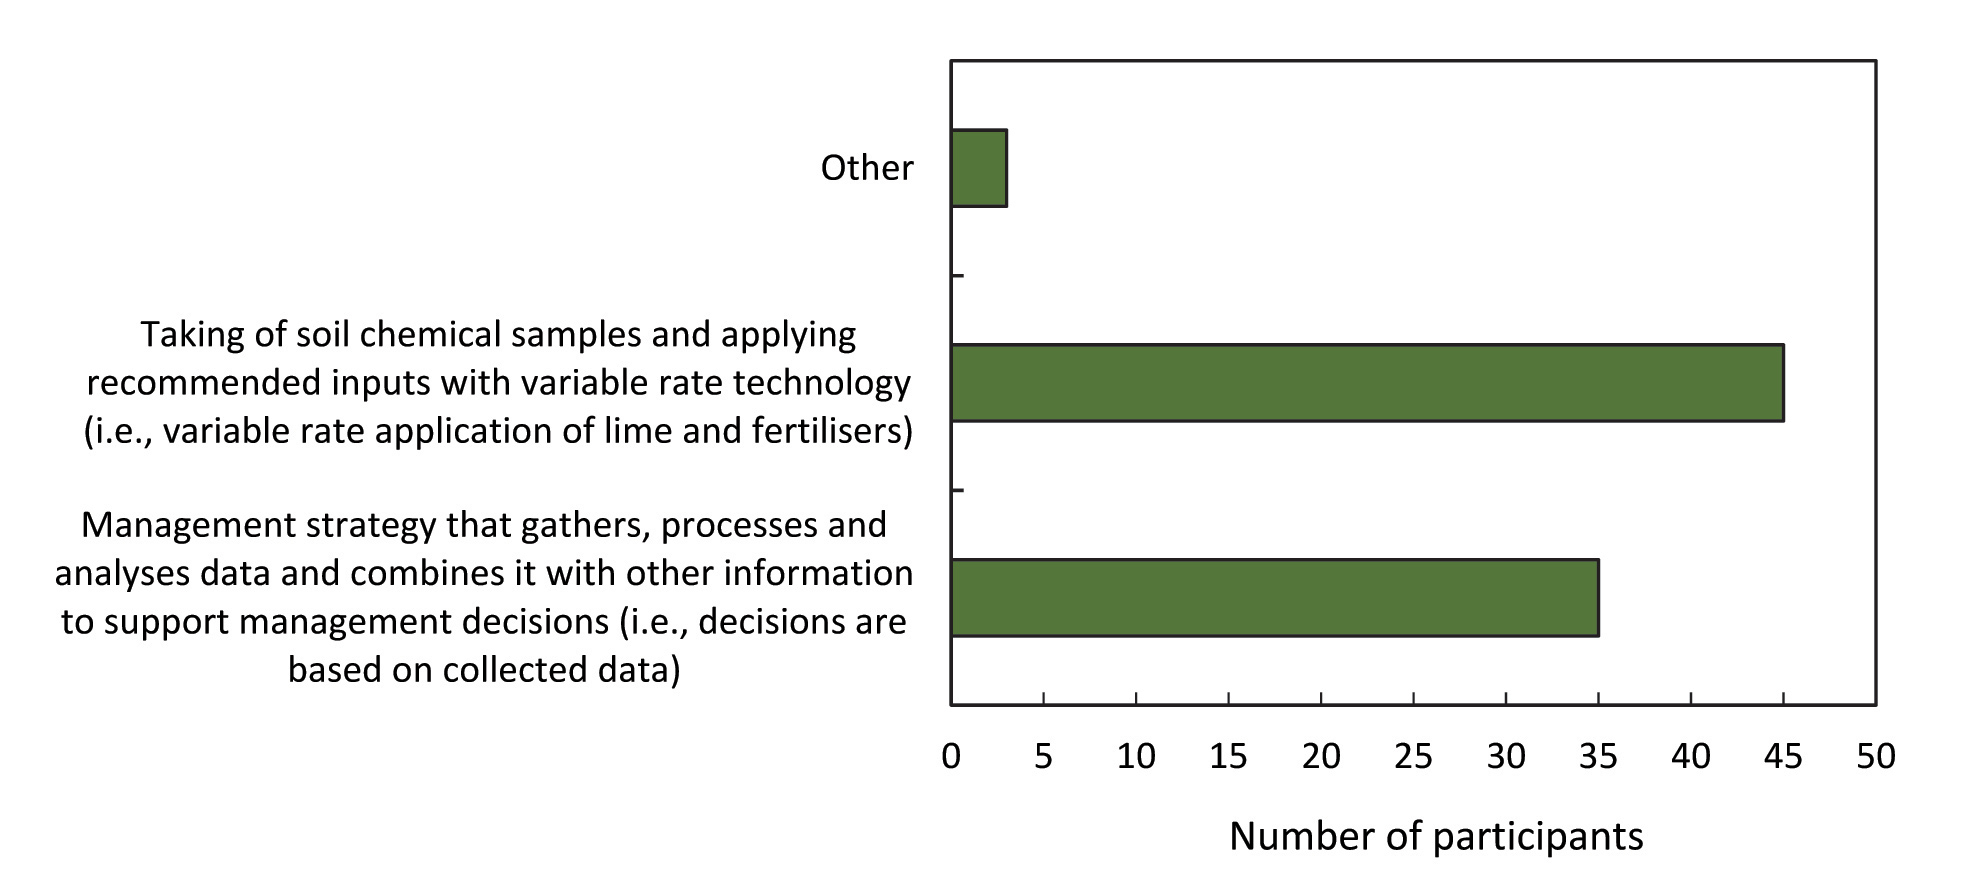
Among the 83 respondents, the largest group fell within the 55- to 64-year age bracket, with no participants under 25 years old. Nearly two-thirds of the respondents farmed on 1 000 ha or more, while only 16% reported operating on less than 500 ha. Most respondents (88%) were farm owners. The survey included a question to gauge perceptions of precision agriculture among participants (Graph 1). There was a 42% and 54% split between possible definitions for precision agriculture, with the remaining 4% selecting ‘other’.
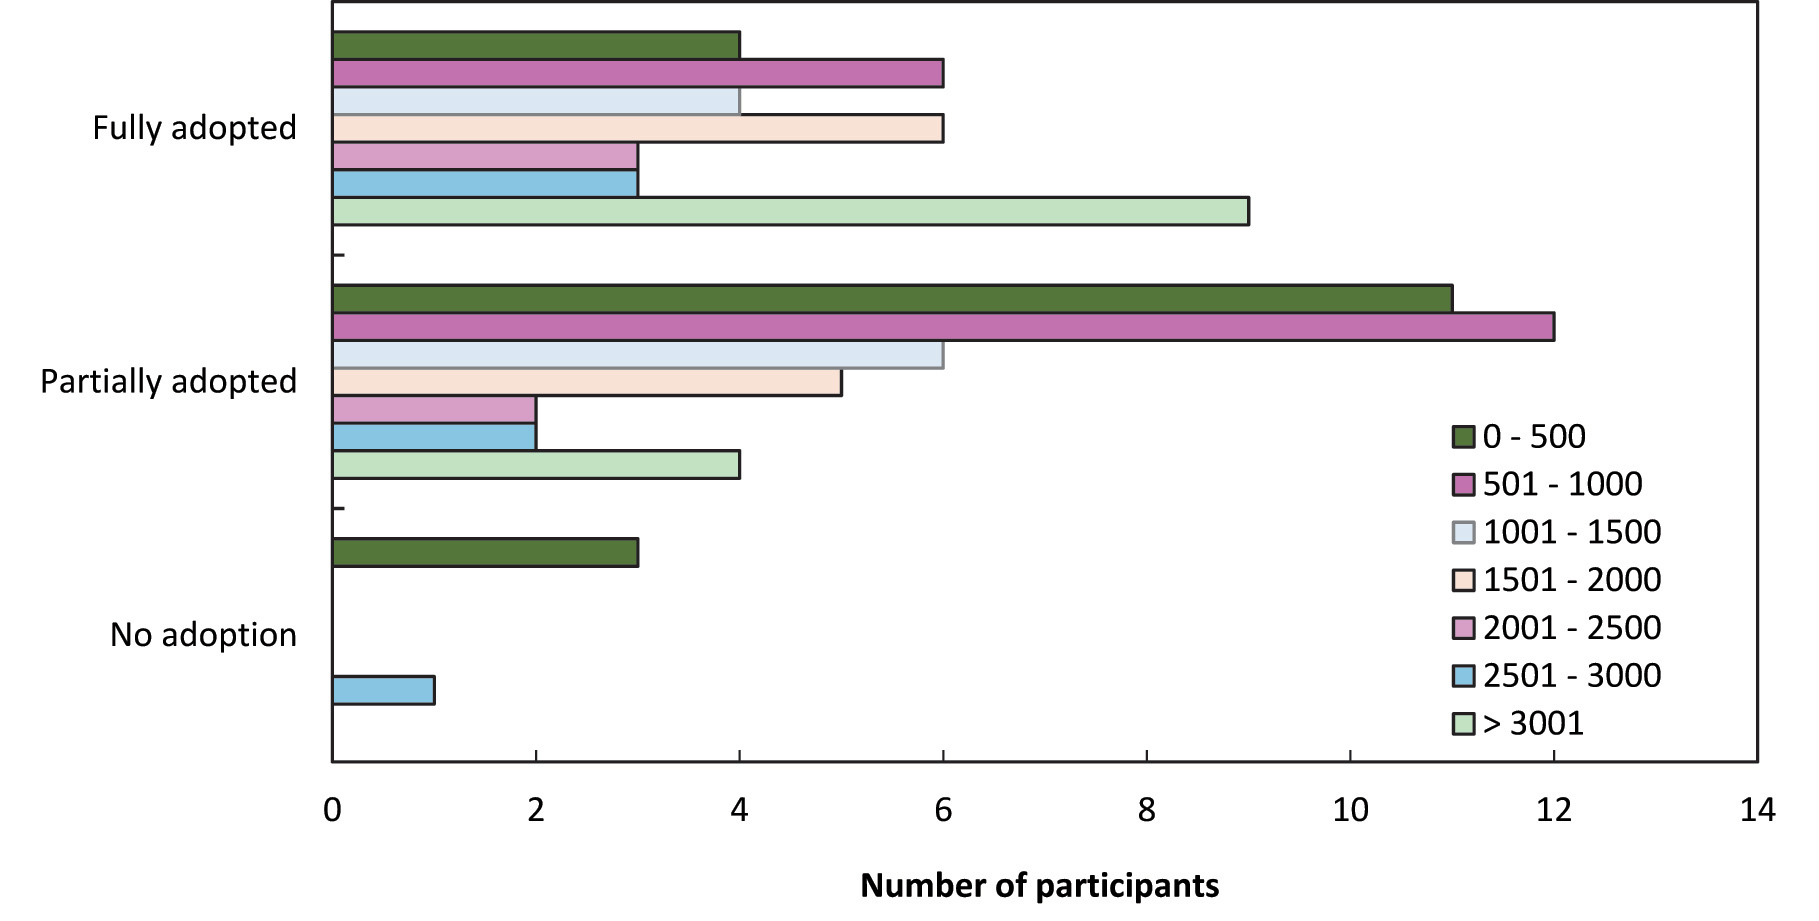
 In terms of adoption, 43% reported full adoption of precision agriculture practices, while 51% indicated partial adoption and only 6% reported no adoption at all. Notably, none of the younger respondents (ages 25 to 34) indicated zero adoption, suggesting a stronger inclination towards integrating technology among younger producers. Adoption patterns across age groups revealed that partial adoption was most common among middle-aged respondents, whereas older respondents tended to either fully adopt or partially adopt, with very few indicating no adoption. Interestingly, farm size did not appear to influence adoption rate, as both small and large farms were represented across all adoption levels (Graph 2). Sampling bias may have occurred, where participants may have been more likely to be progressive producers already engaged in or aware of precision agriculture, leading to overrepresentation of adoption within South Africa.
Furthermore, limited data were collected on farm size, cropped hectares, and economic context. As a result, the survey may not adequately reflect how factors such as farm size, economies of scale, or profitability influence adoption decisions, thereby limiting the generalisability of the findings across different farm types.
Fully adopted: Complete integration of advanced technologies and precision agriculture practices across all farm operations.
Partially adopted: The implementation of some technological solutions and precision agriculture techniques within specific aspects of farm operations, with room for further integration and optimisation.
No adoption: Farming systems with an absence of significant integration of advanced technologies or precision agriculture practices, lacking access to technology in implements and equipment.
Reasons for adoption and key crops
Respondents cited several motivations for adopting precision agriculture, with improving accuracy of applications being the most mentioned reason (61%), followed by enhancing productivity (26%), improving soil conditions (20%), reducing input costs (18%), and reducing overall environmental impact (11%). A few participants also noted that precision agriculture helps increase return on investment and overall profitability. Despite the many benefits, cost was frequently mentioned as a barrier. More than half of those who had not fully adopted precision agriculture said it was too expensive or not cost-effective. Some respondents questioned its relevance to their operations or expressed hesitation due to slow adoption among peers, insufficient technical support, and the need for digital literacy.
Adoption rates were highest among maize, soybean, sunflower, wheat, and canola producers (Graph 3). These crops are typically grown at larger scales and are more suited to technological investment.
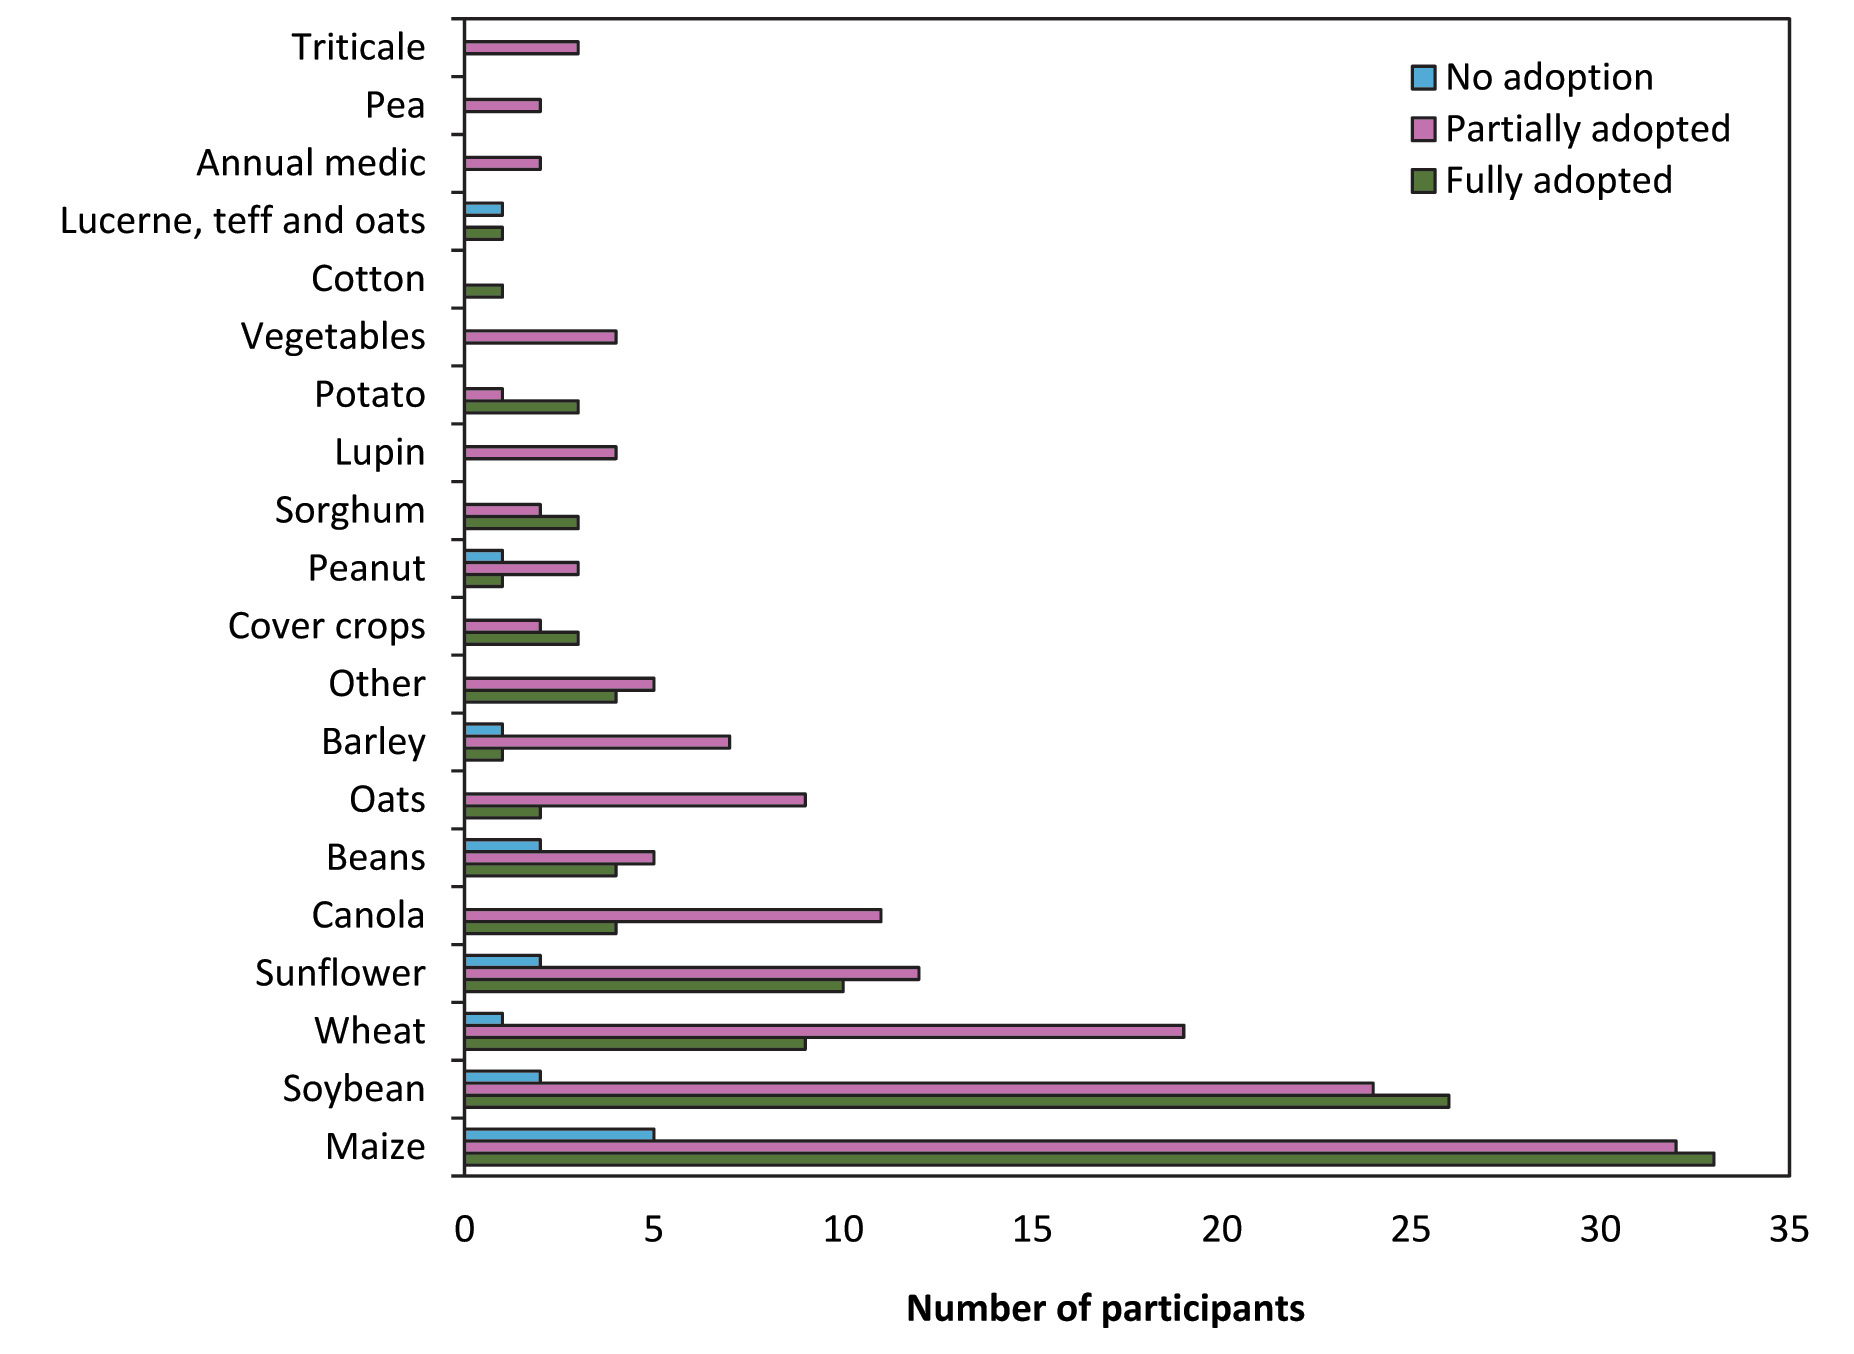
Maize crop production is largely done using precision agriculture practices, with participants either having full or partial adoption rates. Only 7% (n = 5) participants indicated that they do not utilise any form of precision agricultural practices. A similar trend is seen in soybean production systems, with 4% (n = 2) respondents indicating no adoption, with fully and partially adopted begin the highest.
Wheat shows the largest percentage of producers having partially adopted precision agriculture practices (66%, n = 19), with fully adopted practices lagging behind slightly. Very few participants indicated that they have not adopted any precision agriculture practices (3%, n = 1). Sunflower again shows a similar trend to maize and soybeans – probably because the crop is mostly used in a crop rotation system with the other two crops.
Data collection and electronic maps
The recordkeeping landscape can be divided into paper-based and digital or electronic formats (Graph 4). A significant portion of participants (82%) reported collecting farm data, but the majority still rely on paper-based records (45%). Only a smaller proportion use digital tools such as spreadsheets or farm management software. This is notable given that many respondents also indicated full adoption of precision agriculture, suggesting a disconnect between hardware use and digital data management. Transitioning from manual to digital systems remains a key area for development.
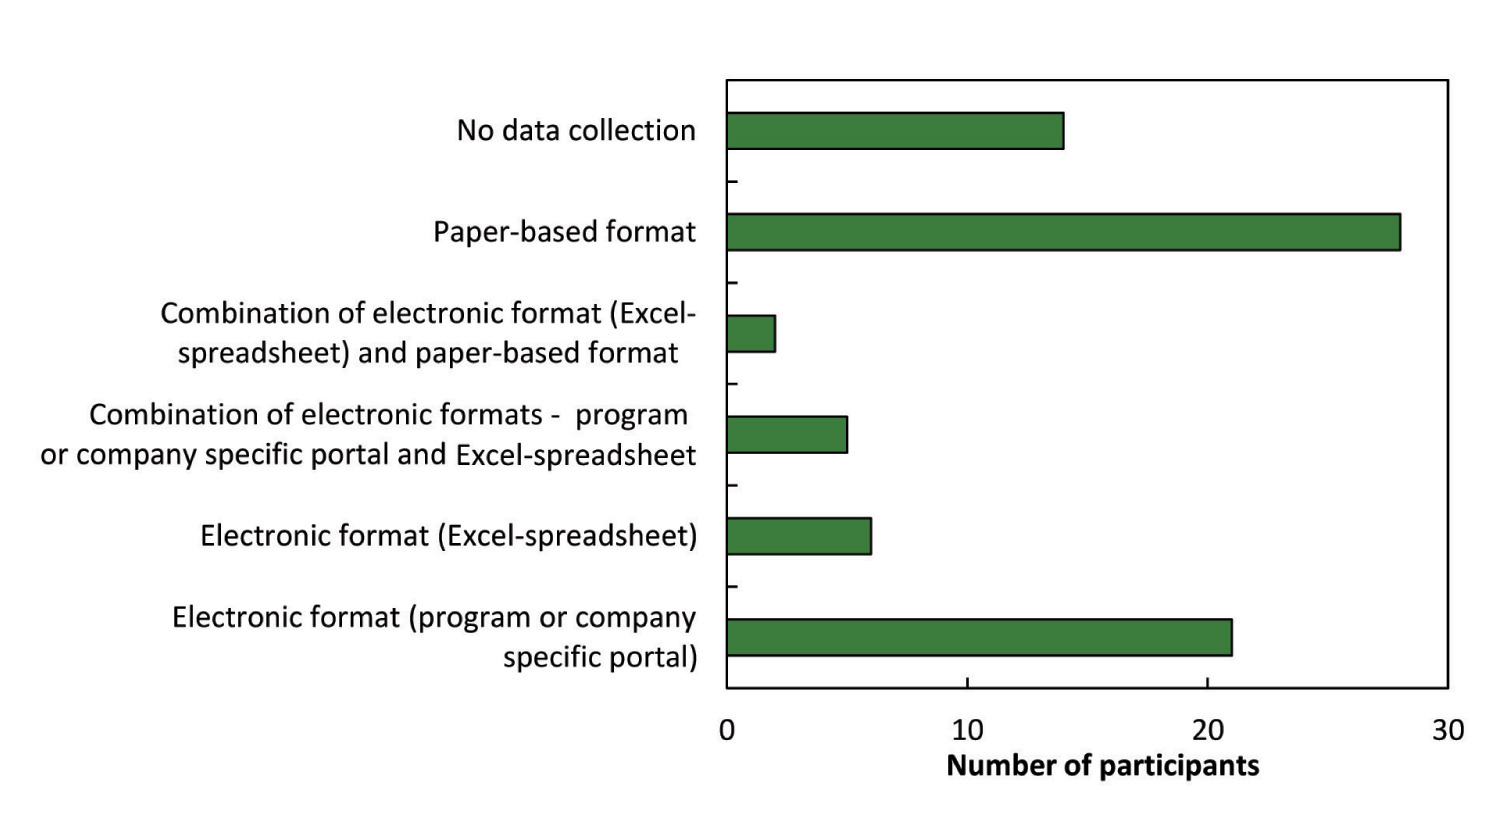
Most respondents in the study reported full adoption of precision agriculture practices yet primarily rely on paper-based data collection. This may be due to several factors, including lack of detailed knowledge about data recording and usage on farms, interpretation of ‘fully adopted’ solely as the use of precision technologies, and limited involvement from producers in actual data interpretation and application.
As-planted and as-applied maps play a crucial role in monitoring and managing field operations in precision agricultural systems. As-planted maps provide a spatial representation of seed placement during planting operations, showing details such as seeding rate, cultivar used, and plant population across the field. They are essential for evaluating planting uniformity and optimising future seeding strategies. Seventy percent of respondents have access to such maps, and among these, 74% use them actively. Common uses include monitoring applications, comparing with yield maps, conducting on-farm trials, maintaining records, managing inputs, and evaluating the accuracy of equipment. These tools are essential for closing the loop between planning, execution, and evaluation.
Yield maps were even more widely available, with 82% of respondents having access. The rest of the participants (18%, n = 13) noted that they do not know how to use the technology (36%, n = 5), their combine harvesters are too old or not compatible (57%, n = 8), or the technology is too expensive (7%, n = 1).
Yield maps are an important tool in precision agriculture, but possession of yield maps does not guarantee that the maps were used in management. Among these, 87% reported using them for decision-making, including identifying management zones, selecting cultivars, planning soil corrections, and refining input strategies. This level of utilisation is higher than previously recorded in other countries.
Soil sampling and variable rate technologies
Grid soil sampling is another foundational practice in precision agriculture, used to assess soil chemical levels and variability across a field. It provides detailed, location-specific data that help producers modify input applications to the unique needs of each area. Only 12% of the participants indicated that they do not make use of grid soil samples (Graph 5).
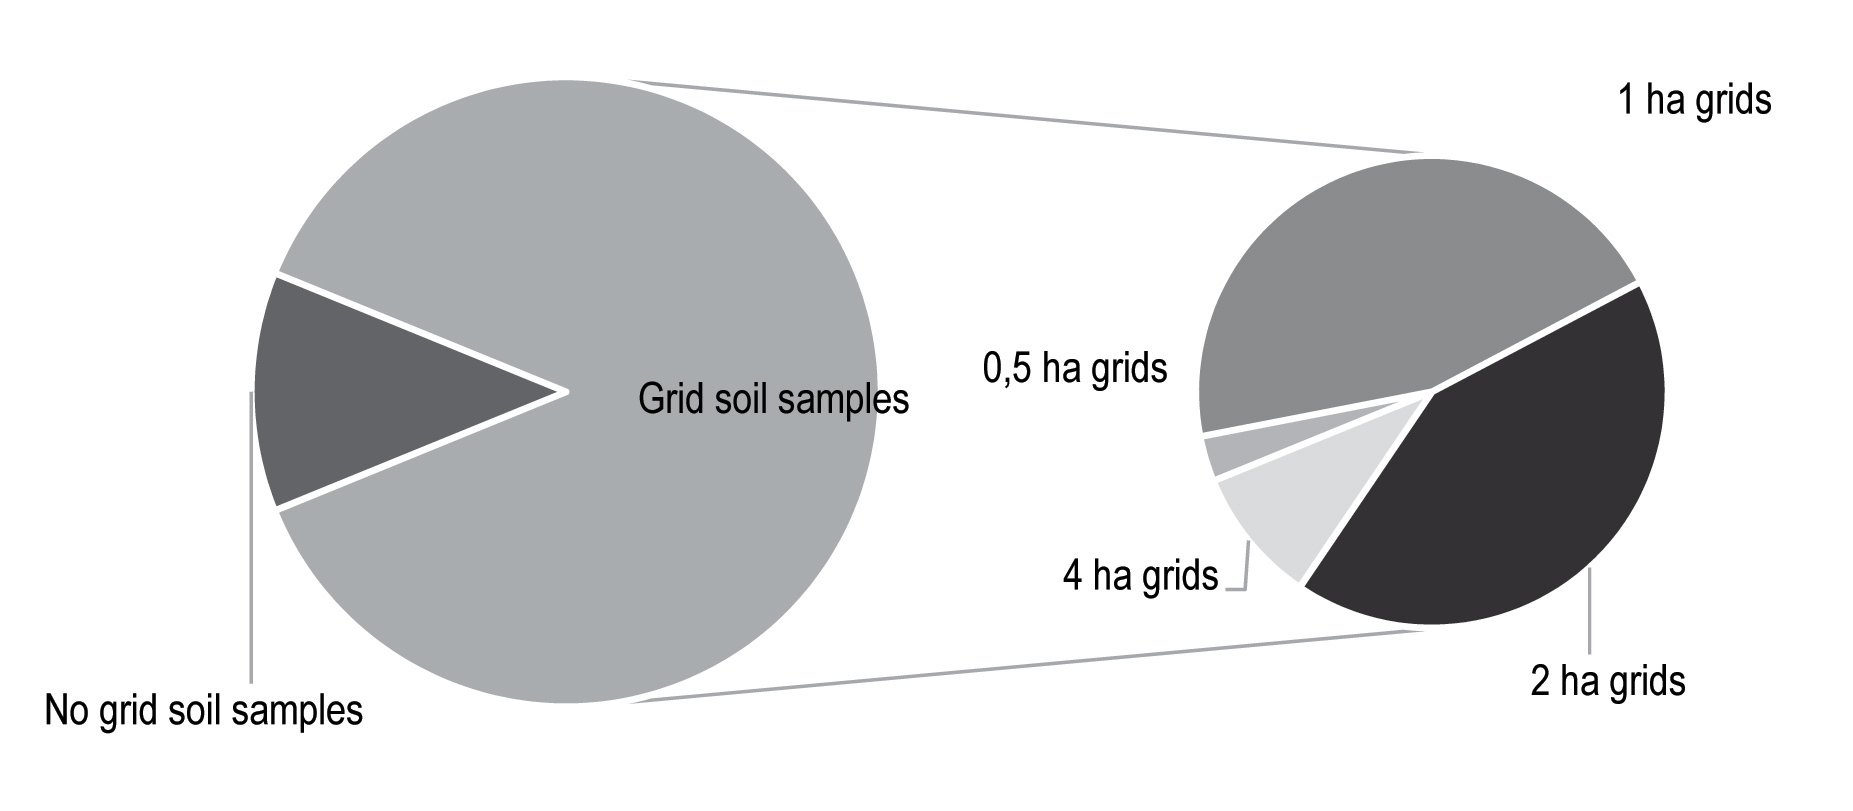
Of those taking grid soil samples, most preferred sizes are 1- or 2-ha grids, although some used finer or coarser grids depending on field variability. Over half of participants also had access to soil classification or physical property maps, although many of these were created some time ago and may not reflect current conditions.
Management zones, which combine grid soil samples and variable rate applications, are sub-field areas within fields that exhibit similar characteristics. Different approaches exist to delineate these zones on farms. This approach enables more precise application of inputs, optimises productivity, reduces costs, and supports sustainable crop production practices. Sixty percent of participants indicated that they make use
of management zones on their farms, mainly using soil potential, yield maps, and soil chemistry to delineate these zones.
Variable rate technology is necessary for adjusting the application of seeds and other inputs based on field-specific variability. Thirty-one participants indicated that they do not have variable rate technologies on their farms. For the remaining 41 who have the technology, the spread of section control, variable seeding rate, and variable fertiliser rate is indicated in Graph 6.
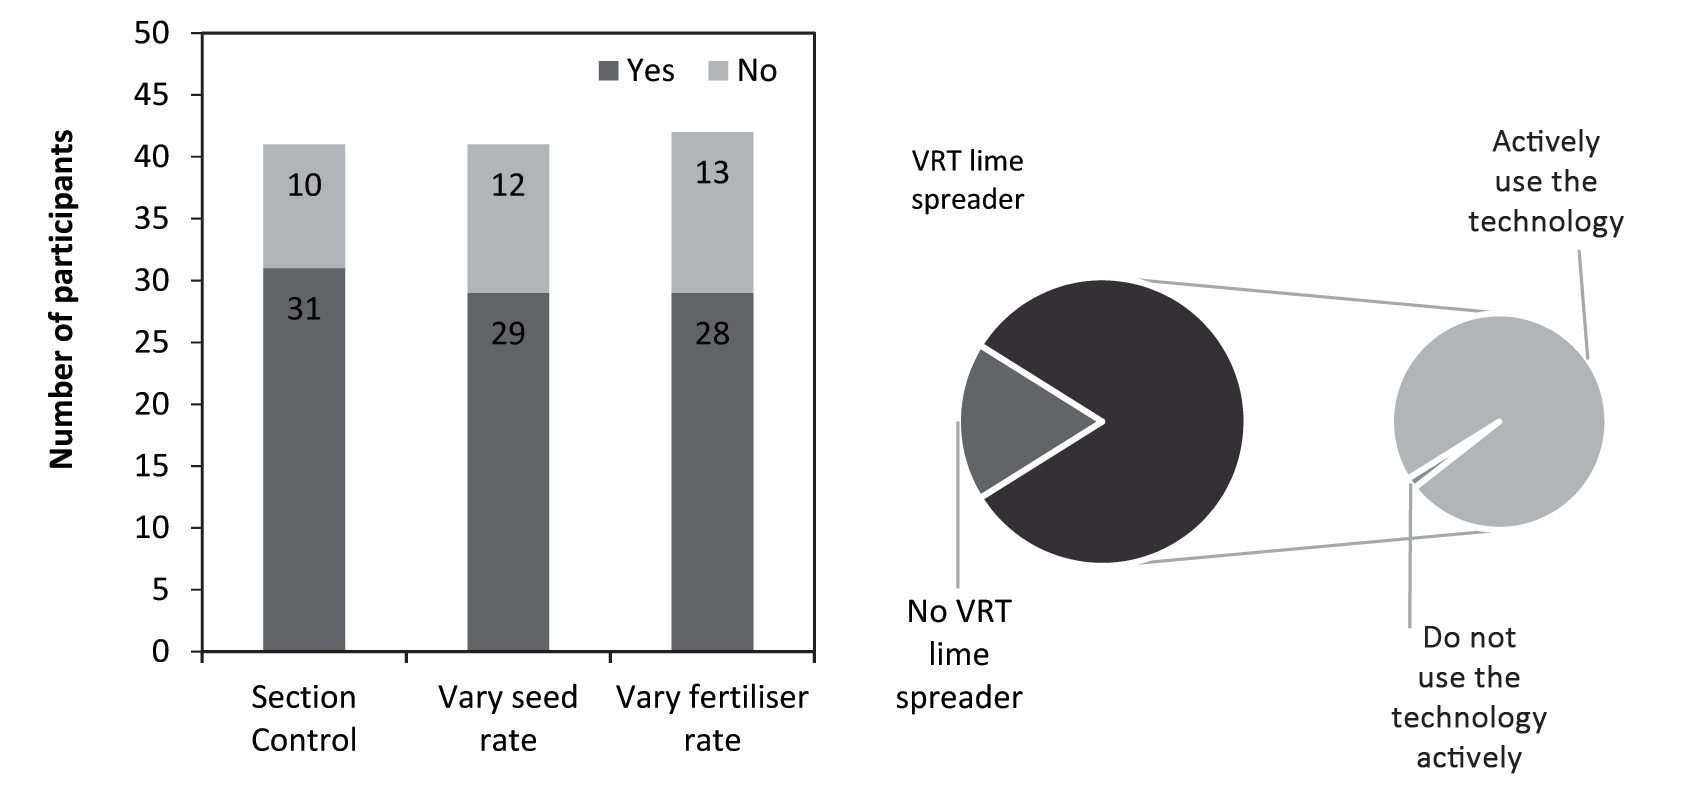
Row crops like maize, soybeans, and sunflower are ranked highest based on the technology utilised in planting equipment. In these crops, variable seeding rate technology is more actively utilised compared to variable fertiliser rate technology. In the small grains like canola, barley, and wheat, only fertiliser applications are varied at the time of planting. The indication of oilseed and small grain seeds being planted variably is less pronounced. Probably due to the technology only becoming more common on farms as of now, previously technology was more prevalent in row crop seeding equipment. Due to the high cost of equipment and new technologies, changes in utilisation will only be noticed when producers upgrade their equipment gradually over time.
Conclusion
The survey reveals a broader uptake of precision agricultural practices than previously documented. Forty-three percent of respondents have fully adopted precision agricultural practices, while 51% indicate partial adoption. However, barriers such as financial constraints, limited understanding of precision agriculture applications, and regional disparities in technology marketing remain. Differences between summer and winter regions are prevalent, with maize, soybean, and sunflower producers mostly either fully or partially adopting precision agriculture practices.
The transition from data collection to informed decision-making is not yet fully realised, with 45% of participants still using paper-based formats. Addressing this gap requires greater emphasis on research, education, and industry-driven support initiatives. Encouraging digital data collection methods and refining communication about precision agricultural practices can enhance its impact on farm efficiency and sustainability.
The survey confirmed that different technologies within the precision agriculture sphere are adopted at different rates. Seventy percent of participants have access to as-planted and as-applied maps, while 74% of them actively utilise it. The same group of participants indicated that 82% of them have access to yield maps, and 87% of them utilise it. The taking of grid soil samples is high compared to other countries at 88%, with grids of 1 ha and 2 ha being most prevalent. Planters equipped with variable seed rate equipment are more actively used in maize, soybean, and sunflower crops, with variable rate fertiliser technology lagging slightly behind.
Although it is a short-term snapshot of adoption and may not account for seasonal variability and long-term adoption trends, these findings highlight both the momentum and the missed opportunities within South Africa’s precision agriculture landscape. By bridging the gap between data collection and actionable insight, and by tailoring support to regional and crop-specific needs, the industry can unlock greater efficiencies, resilience, and sustainability for the future of South African field crop production.
Reference
Truter, KJ, Glas, H, Delport, M, Meyer, FH & Swanepoel, PA. 2025. Adoption of precision agricultural practices in South African field crop production systems: A national survey. South African Journal of Plant and Soil. [In press]. https://doi.org/10.1080/02571862.2025.2535285
Lowenberg-DeBoer, J & Erickson, B. 2019. Setting the Record Straight on Precision Agriculture Adoption. Agronomy Journal, 111(4): 1552 – 1569. https://doi.org/10.2134/agronj2018.12.0779


