


Dr Hendrik Smith, ASSET Research

Prof James Blignaut, ASSET Research

Mary Maluleke, ASSET Research

Petru Fourie, AFMA
In 2024, ASSET Research conducted a Maize Trust-funded study to assess the experiences of selected conservation agriculture (CA) producers concerning their transition from conventional tillage (CT) to no-till (NT) or CA, the latter being a much more integrated system. Researchers wanted to understand the impact such a transition has had on the cashflow of the operation, most notably the prevalence of the so-called J-curve, and the management thereof. The J-curve is often also called an investment curve and is a common and regular phenomenon with respect to most forms of investment – it is not unique or limited to agriculture or the transition from CT to NT or CA.
When an investment is made in a new technology and/or strategy, it does imply an initial increase in the outflow of funds. This initial outflow is made in the anticipation of higher returns later, and/or that the investment will mitigate potential future risk that is associated with the current practices. In this sense it acts as a form of insurance policy hedging against future risk and associated losses. The term J-curve is derived from the shape of the cashflow projection over time with the initial increase in outflow reducing the cashflow, but above average returns in future while mitigating a range of risks and increasing farm-wide resilience (see Maluleke et al., 2024).
To gain an understanding of how producers experienced and managed the J-curve, a questionnaire was developed aimed at assessing the experiences of CA producers concerning their transition from CT to NT or CA. The online questionnaire included sections on their practice region, motivating factors to change, familiarity and experience with the J-curve, challenges faced during the transition period, solutions to overcoming these, as well as support. A total of 25 experienced and knowledgeable CA producers (or farms) in the different production regions were identified. Upon the survey due date, data were collected, compiled, and analysed. A total of 21 responses were received.
Producers’ familiarity and experience with the concept of the J-curve
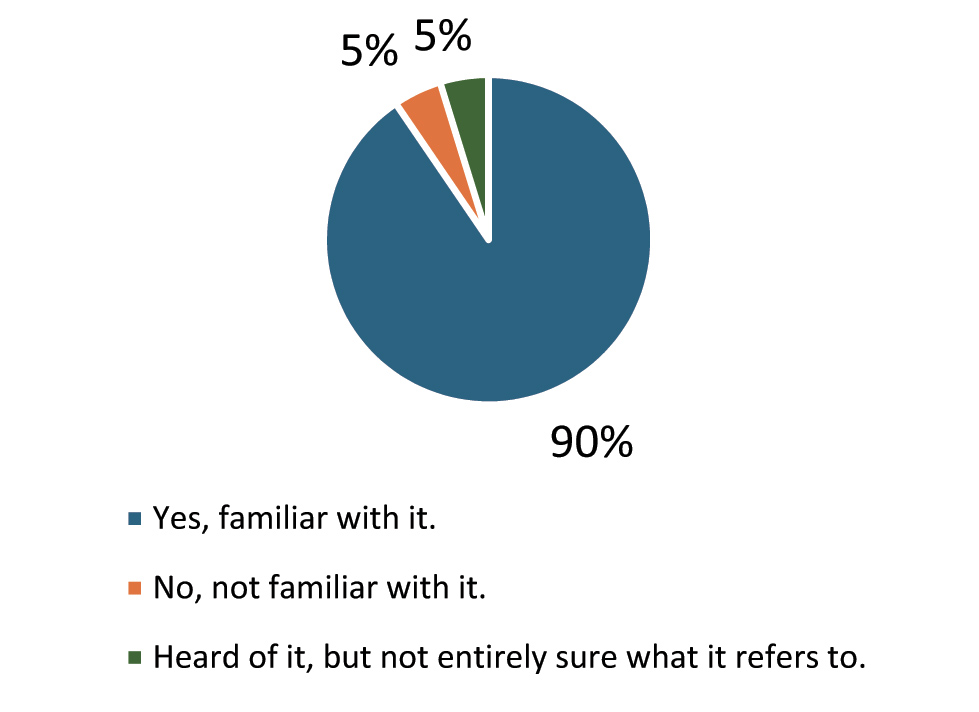
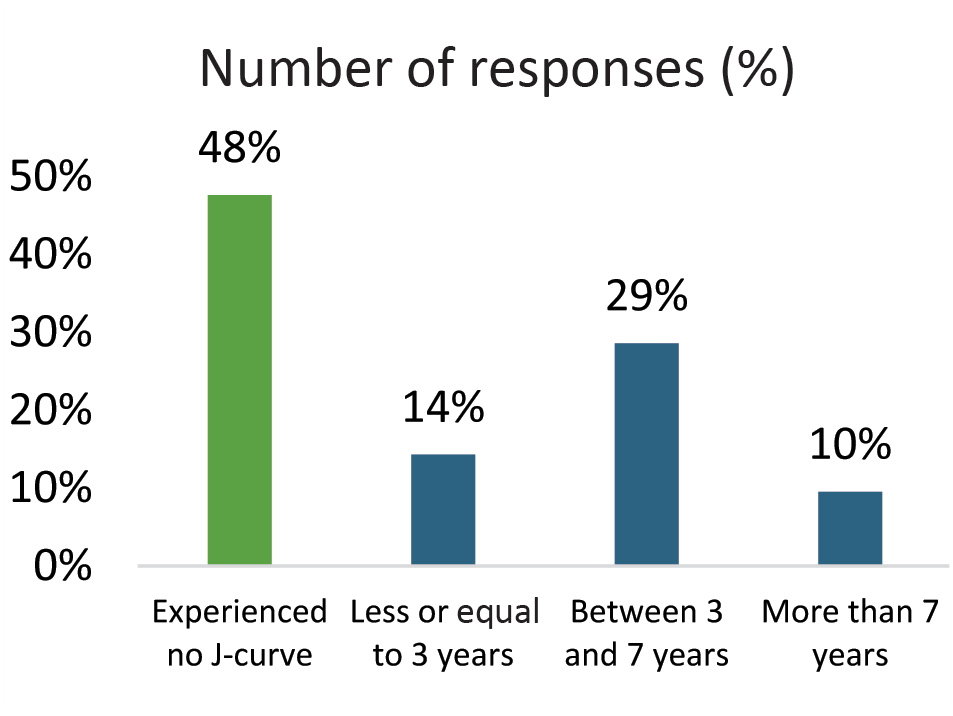
Of all producers, 90% said to be familiar with the concept of the J-curve, while 5% were not and the rest had heard of it but were not entirely sure what it refers to (see Figure 1). When asked if they had experienced the impact of the J-curve, almost half (48%) had not, 14% had but for less than 3 years, 29% between 3 and 7 years, and 10% for more than 7 years (see Figure 2). The full report is available online at https://assetresearch.org.za/financial-analysis/.
Note: Producers were asked to indicate their experience of the J-curve in years with the option to select 0 = “have not experienced” or state the “number of years it took to go through it”. Their answers were categorised as either 0 = experience no J-curve, 1 – 2 = less than or equal to 3 years, 4 – 7 = between 3 and 7 years, and 8+ = more than 7 years. The graphs reflect the percentage of the sum of each category out of the total number of responses received.
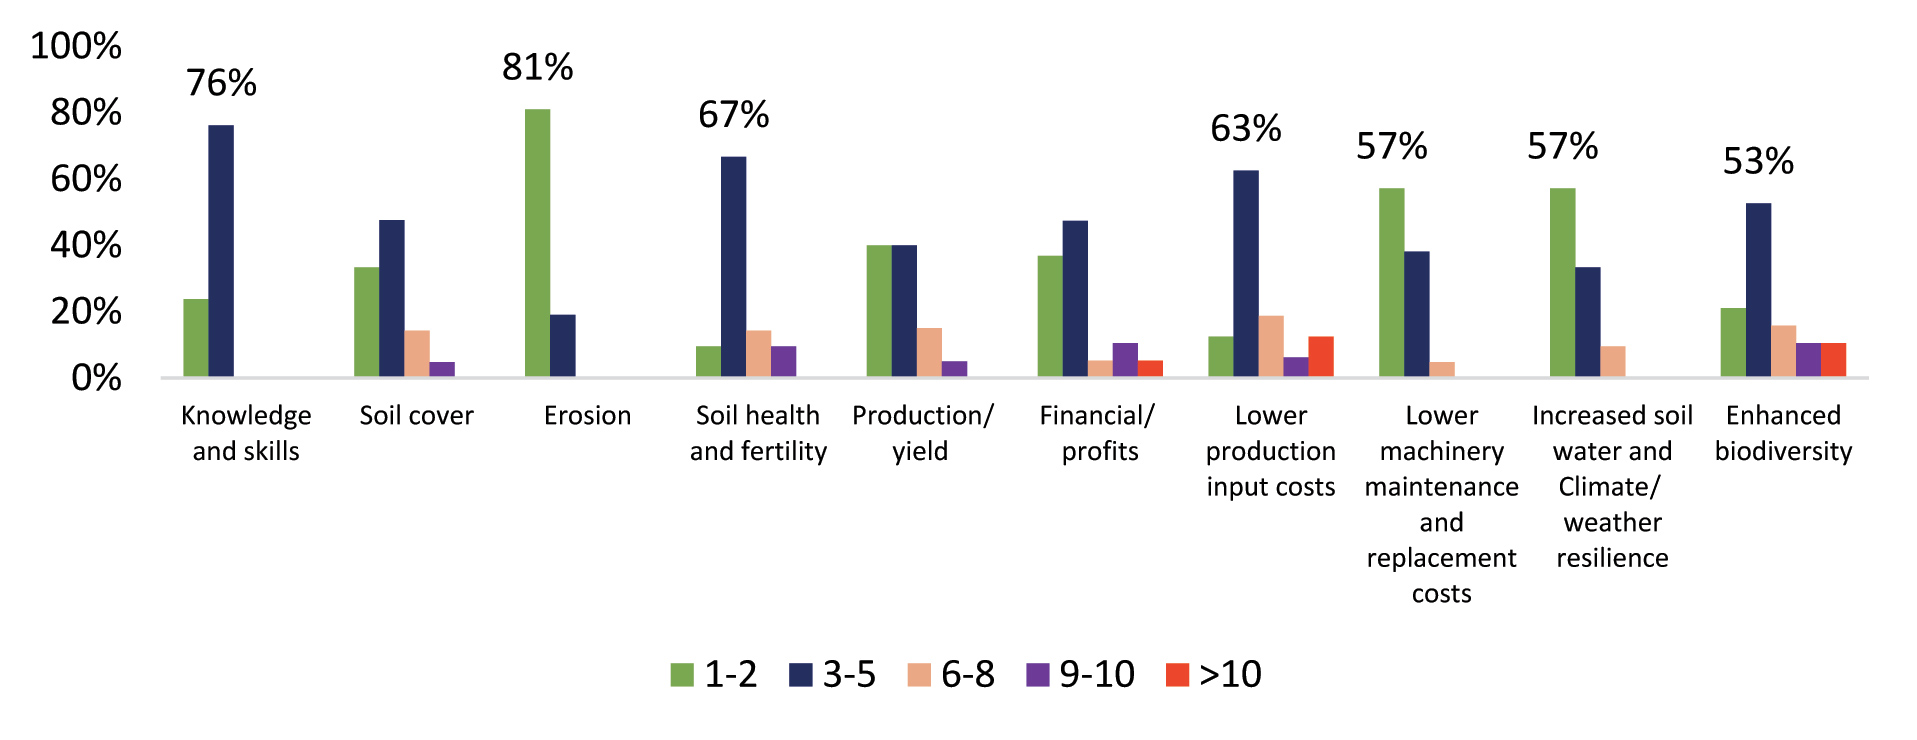
The time it took before producers observed any positive changes or benefits
There were varied responses to the duration of time it took before producers observed any positive changes or benefits following the initial dip in productivity or income (see Figure 3). The results indicate that most producers saw positive changes in erosion, lower machinery maintenance and replacement costs, and increased soil water and climate/weather resilience between 1 and 2 years. Knowledge and skills, soil health and fertility, lower production input costs, and improved biodiversity were found, by most producers, to yield benefits after 3 to 5 years. Positive changes or benefits from financial profits and production/yields were said to mostly translate between 1 and 5 years with some indicating it took them between 6 and 10 years.
Note: Producers were asked to indicate their answers on a scale of 1 to 10 years, with an additional option of more than 10 years as well. The green bars reflect the percentage of the sum of the 1s and 2s out of the total number of responses received; the blue bars reflect those of the 3s to 5s; the light brown bars those of the 6s to 8s; the purple bars those of the 9s and 10s; with the red bars reflecting those greater than 10. The percentage add to 100%, and the highlighted colour bars indicate the major reasons.
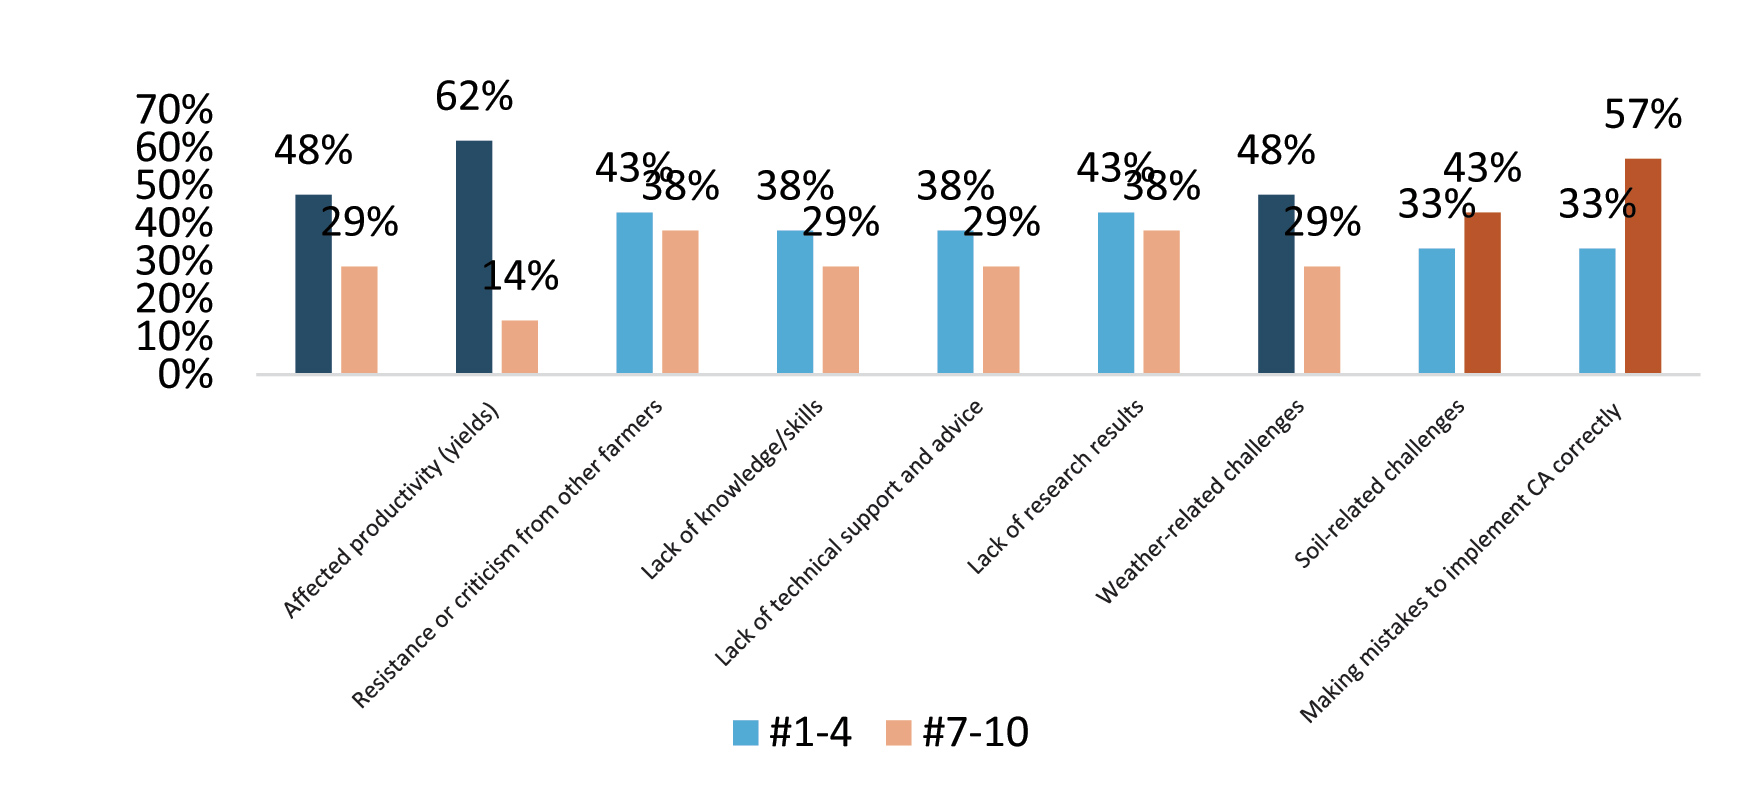
General challenges faced during the transition period
Producers were asked to indicate the biggest challenges they faced during the transition period. The majority indicated that they were making mistakes in implementing CA correctly and soil related challenges (e.g., too sandy). This was because of a lack of experience and knowledge, but it can be overcome with time, experience, and exposure to other operations. Contrary to expectation, affected productivity (yields), financial constraints, and weather-related challenges imposed the least challenge on most of the producers (see Figure 4).
Note: Producers were asked to indicate their answers on a scale of 1 to 10, with 1 = “no or little” and 10 = “very high”. The blue bars reflect the percentage of the sum of the 1s to 4s out of the total number of responses received, with the light brown bars the percentage of sum of the 7s to 10s. The percentage does not add to 100%; the balance being the sum of those that scored 5s and 6s. The highlighted blue and brown bars indicate the major reasons.
Level of difficulty producers faced with different CA practices during the transition period
Producers were also asked to indicate the level of difficulty they faced with implementing different CA practices during the transition phase (see Figure 5). The following principles were rated most difficult: integrated weed management, living roots in the soil, integrated soil fertility and acidity management, and soil cover.
The principles they found least difficult to implement, are: livestock integration, cash crop rotation, and access and use of CA machinery/implements.
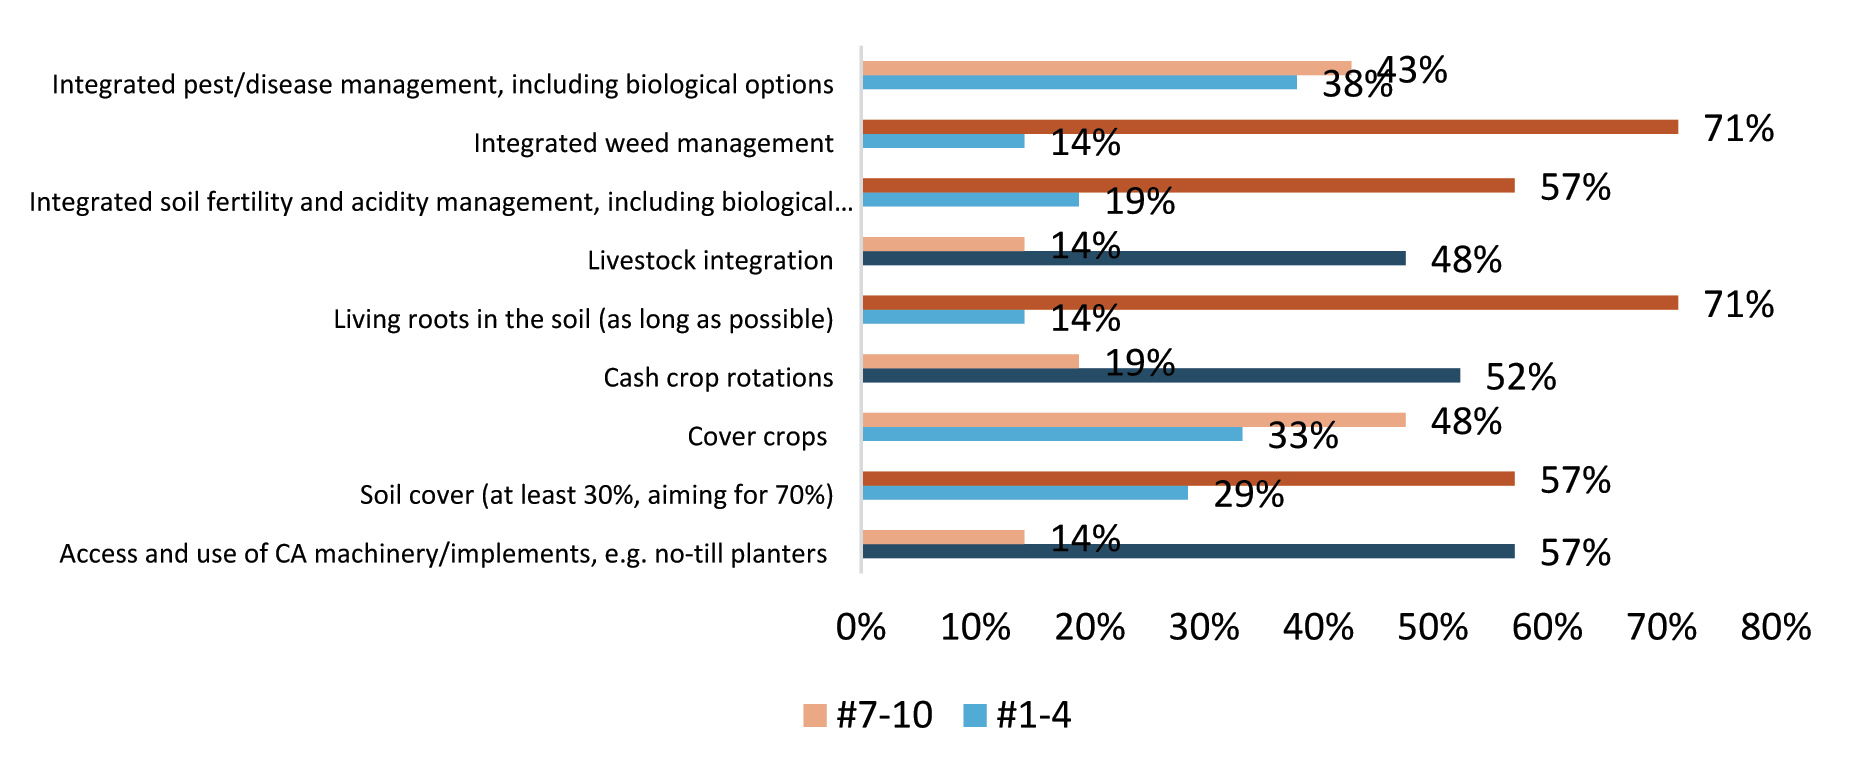
Note: The graph scales were treated like Figure 3.
How producers managed to overcome the above challenges during the transition phase
They were also asked to indicate how they managed to overcome a list of common challenges in the transition phase. Improvement of knowledge and skills; (on-farm) testing and adapting of CA practices, regular monitoring and evaluation of results; joining study groups or networks for support; and seeking assistance from research/technical experts were used most to manage or overcome challenges during the transition phase. The strategies least used to manage or overcome challenges during the transition phase include using other sources of income and selling off other assets (see Figure 6).
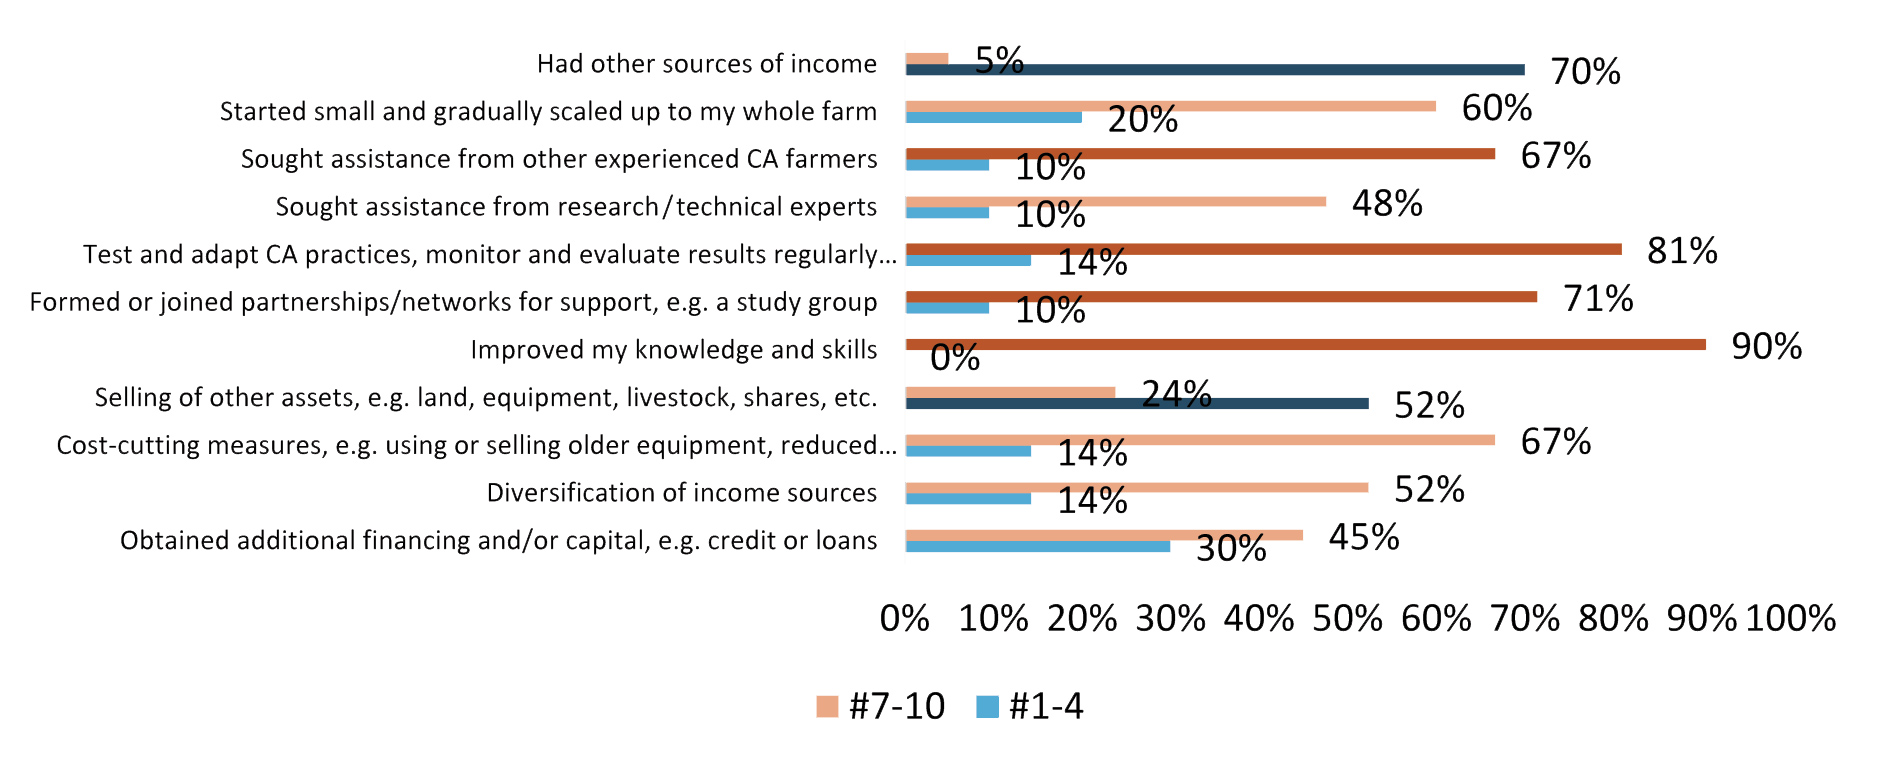
Note: The graph scales were treated like Figure 3.
Support and resources most helpful for information and advice during the transition process
In response to the question as to which resources and methods of support they found most useful, producers indicated that most of the support services offered were found helpful (see Figure 7). However, CA conferences and farmers’ days were found the most helpful, followed by other experienced producers through cross-visits, etc.; study groups (including WhatsApp groups); and social media, e.g., YouTube, Facebook, Internet websites, etc. Interestingly, technical manuals, guidelines and publications were the least helpful relatively.
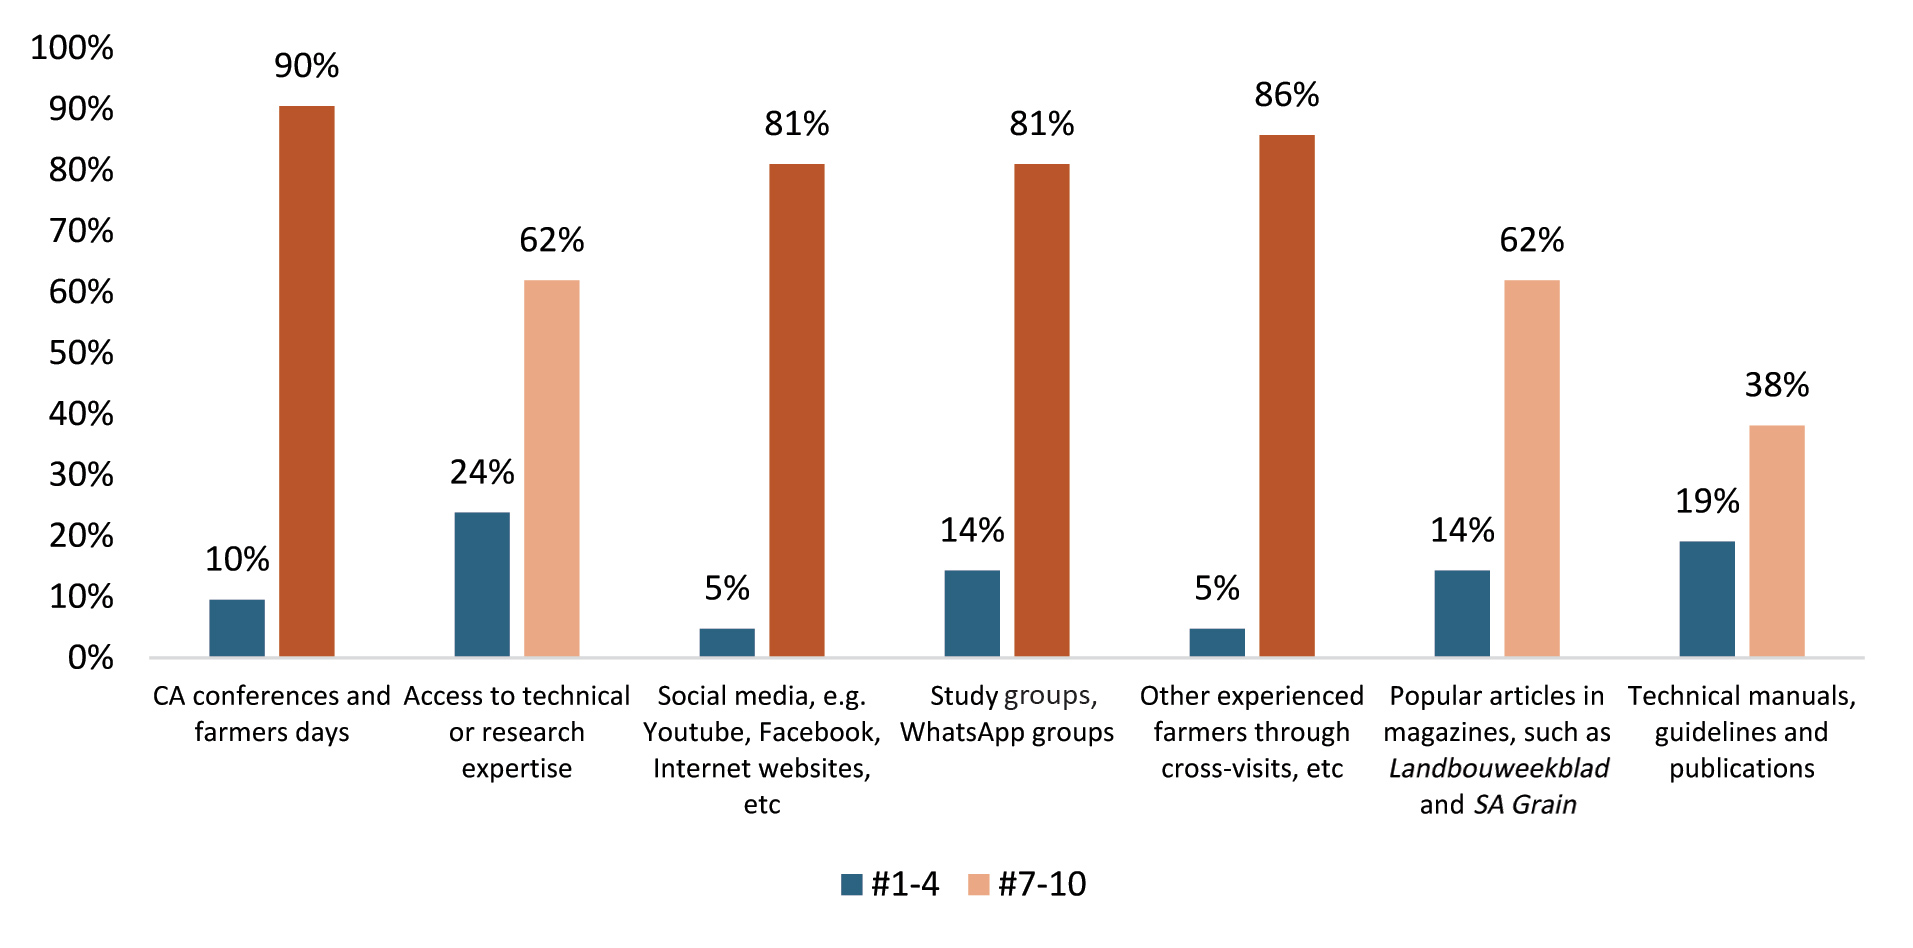
Note: The graph scales were treated like Figure 3.
Reference
Maluleke, M, Van Schalkwyk, N, De Beer, A, Smith, H, Blignaut, J, Knot, J, Trytsman, G, and Erasmus, L. 2024. Comparing the financial benefits of different grain production systems in South Africa’s summer rainfall region. South African Journal of Science, 120(7/8). https://doi.org/10.17159/sajs.2024/17091.


