


landbou-ekonoom,
Graan SA, christiaan@grainsa.co.za
In 2023, 86% of fertilisers sampled in the annual fertiliser and lime quality monitoring project complied with all the quality requirements.
The project started in 2017 when a memorandum of understanding for the funding and management of a fertiliser and lime quality monitoring project was entered into by and between the then Department of Agriculture, Forestry and Fisheries, the Fertiliser Association of Southern Africa (Fertasa), Grain SA and the Sasol Agricultural Trust.
This project continued in 2023, with the aim to establish whether the quality of liming material and fertiliser is maintained according to the regulations of the Fertiliser Act (Act No. 36 of 1947) through random sampling of at least 140 fertilisers and ten lime sources.
 Fertiliser results
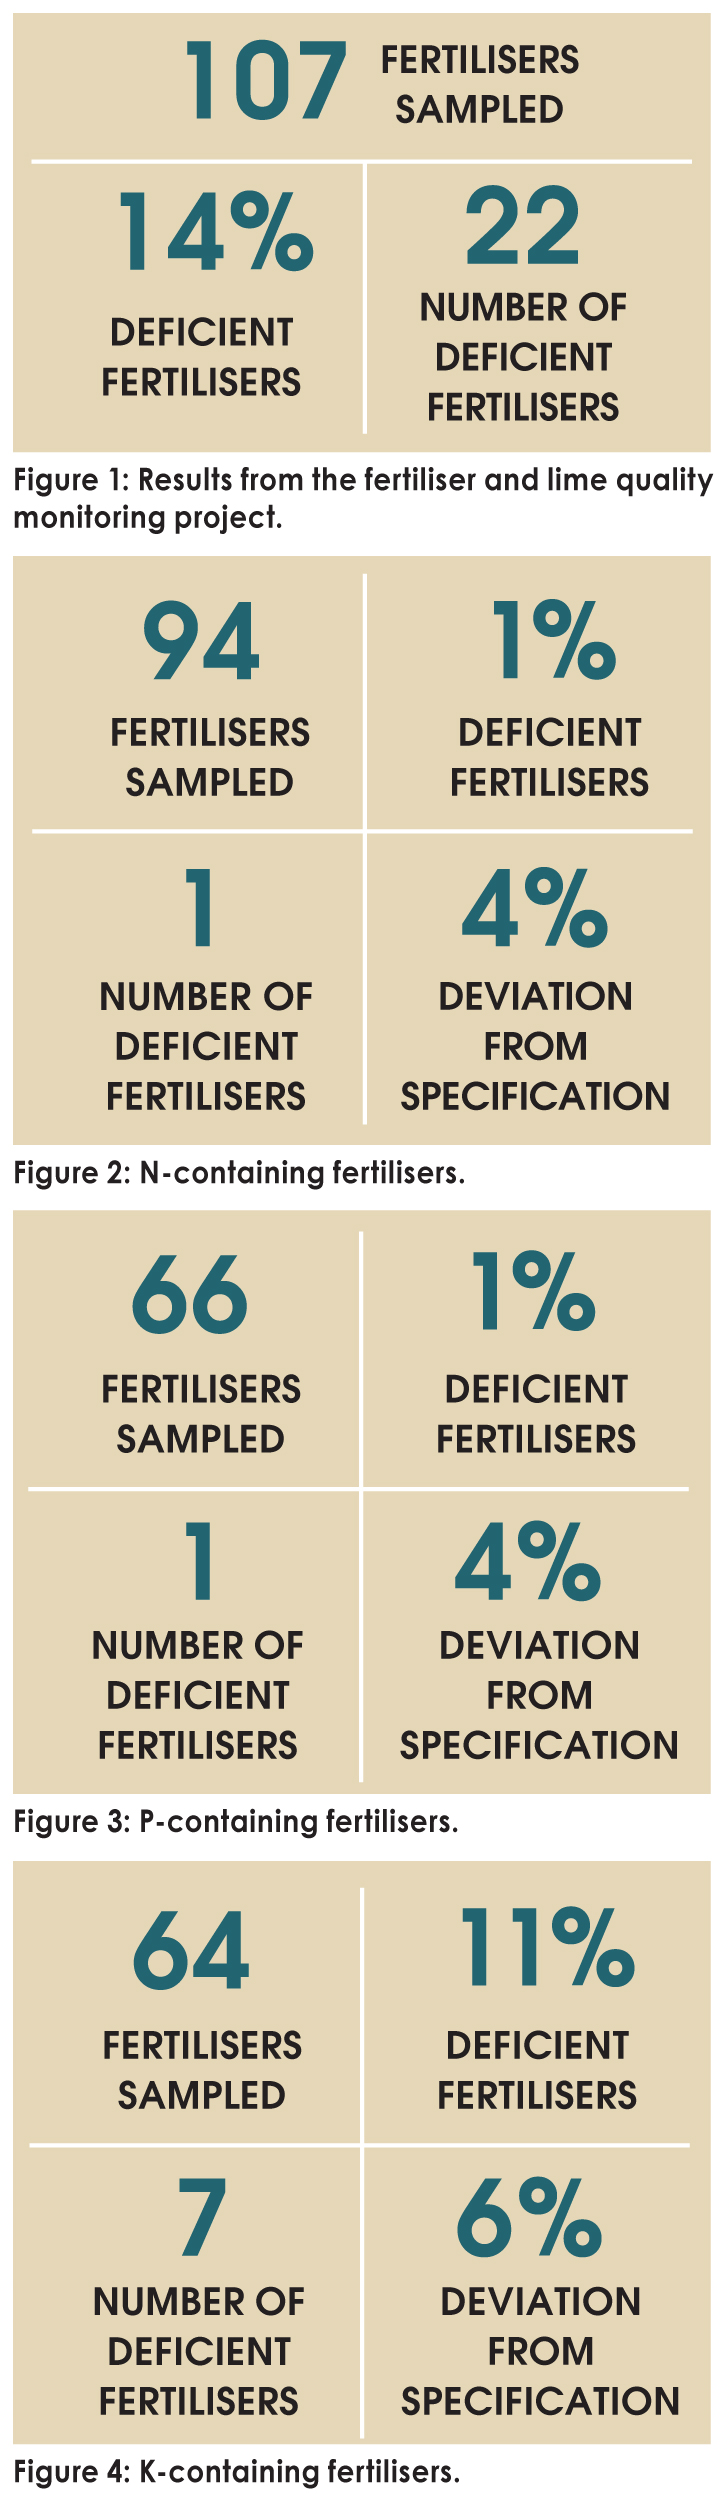
Of the 107 fertilisers, 7% were deficient in one nutrient or total nutrient content and 8% had two, three or four deficiencies. Of the 94 nitrogen-containing fertilisers, 99% were compliant in respect of N. Of the 66 fertilisers containing phosphorus, 91% were compliant for P and of the 64 potassium-containing fertilisers, 89% were compliant regarding K. Eleven fertilisers contained calcium with 91% compliancy, 51 contained sulphur with 92% compliancy and five contained magnesium with 100% compliancy. Seven fertilisers contained one or more of the following nutrients: boron, copper, molybdenum, manganese and iron, all in compliant quantities. Of the 37 fertilisers containing zinc, 89% were compliant for Zn. The Fertiliser Act stipulates that the total nutrient content (N + P + K) of a fertiliser should not deviate by more than 14 g/kg from the registered content. This applied to 77 fertilisers with 92% of them compliant.
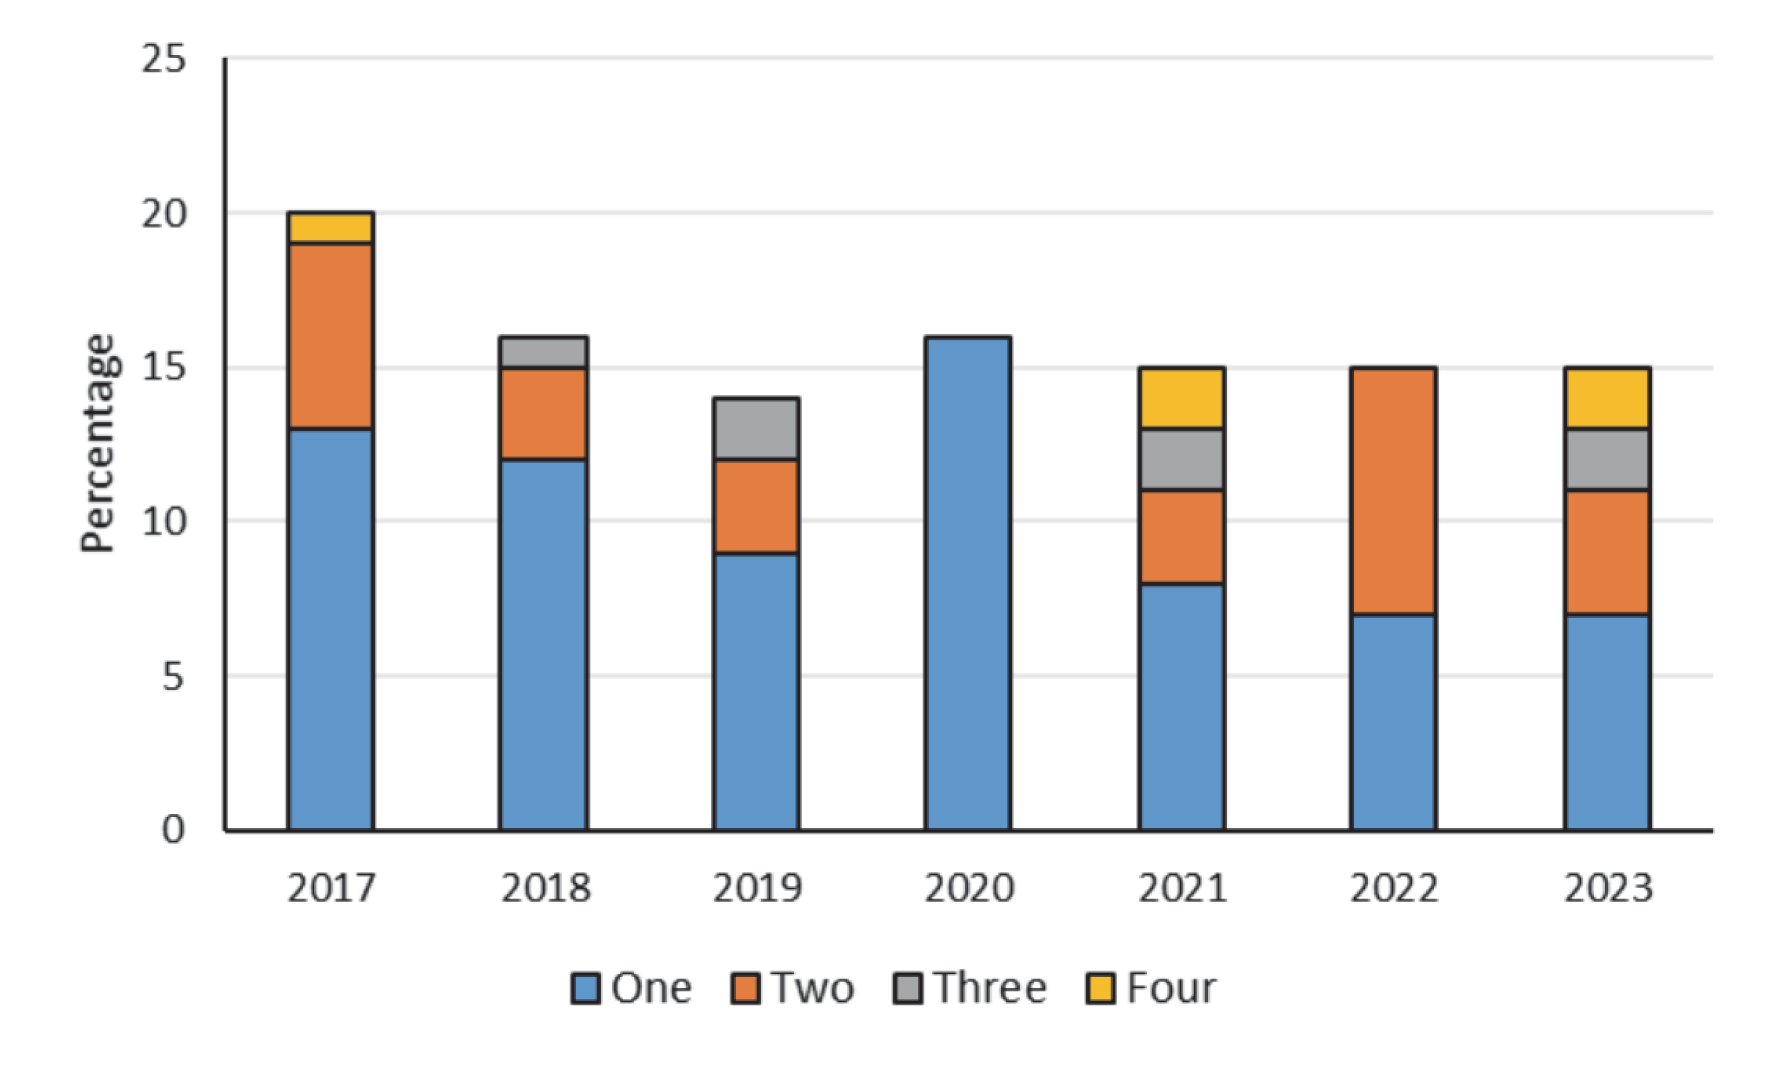
Figure 5 indicates the percentage of fertilisers with one, two, three and four deficiencies. Between 2017 and 2020 fertilisers with multi-deficiencies decreased to only single deficiencies. But from then on this trend took a negative turn with some fertiliser samples indicating four deficiencies in 2021 and 2023 and some samples indicating two deficiencies in 2022.
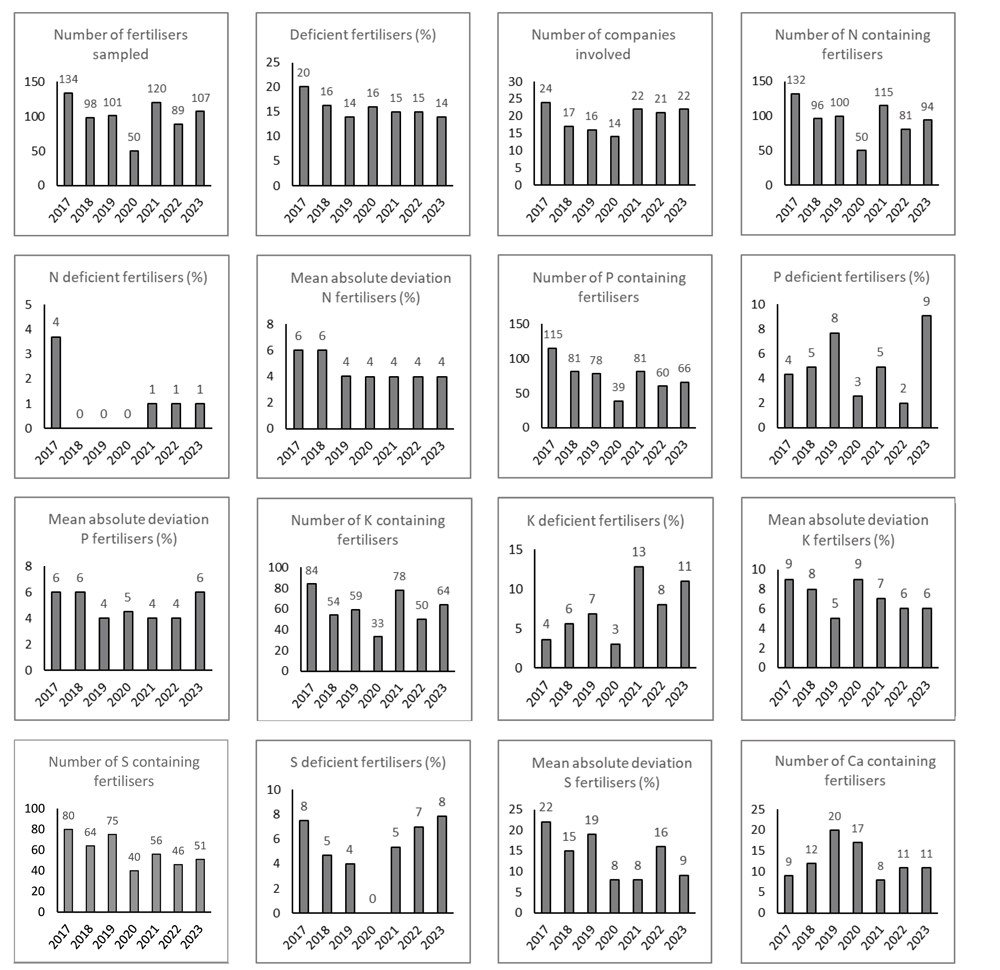
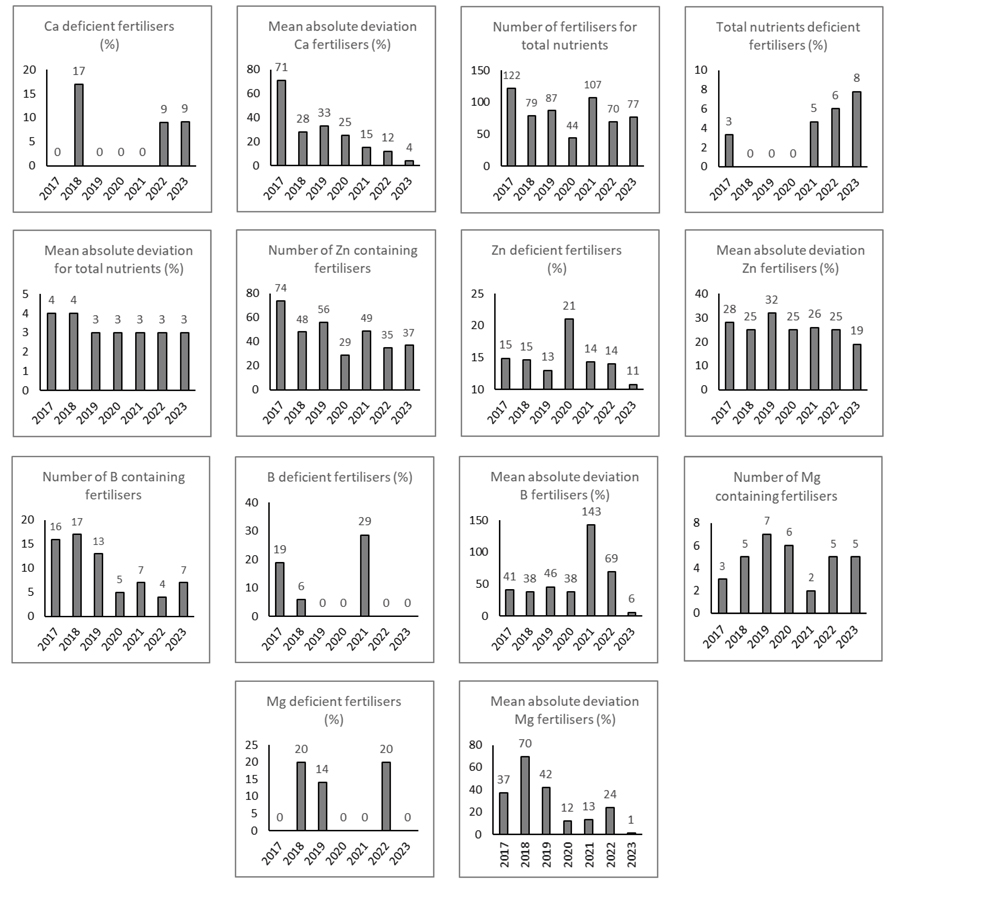
Figure 6 shows the number of fertilisers, percentage deficiencies and mean absolute deviation from the registered contents for the various nutrients and total nutrients from 2017 to 2023.
Conclusion: fertilisers
Of the fertilisers sampled in 2023, 86% complied with all the quality requirements, in many cases with nutrient levels significantly above their registered contents. However, 14% of fertilisers – all blends – were non-compliant in one or more aspects. Zinc and potassium are notable as 11% of fertilisers containing either of them were non-compliant. Furthermore, phosphorus, sulphur, calcium and total nutrients were deficient in 8% to 9% of fertilisers containing them and those to which the total nutrients regulation was applicable. Only 1% of nitrogen-containing fertilisers was deficient in respect of N. Few fertilisers contained boron (7), copper (1), iron (1), magnesium (5), manganese (3) and molybdenum (1), all of which were compliant.
From 2017 to 2018 the fraction of non-compliant fertilisers showed a significant decline and since then has levelled off to between 14% and 16%. The mean absolute deviation of the nutrient content of some major nutrients, namely nitrogen and total nutrients, had a declining trend, levelling off from 2017 to 2023, while potassium, sulphur, calcium, magnesium and zinc are still declining. Phosphorus and boron show no apparent trend. These declining trends indicate that the precision of fertiliser manufacturing and blending in respect of these nutrients has improved over time.
Lime and gypsum results
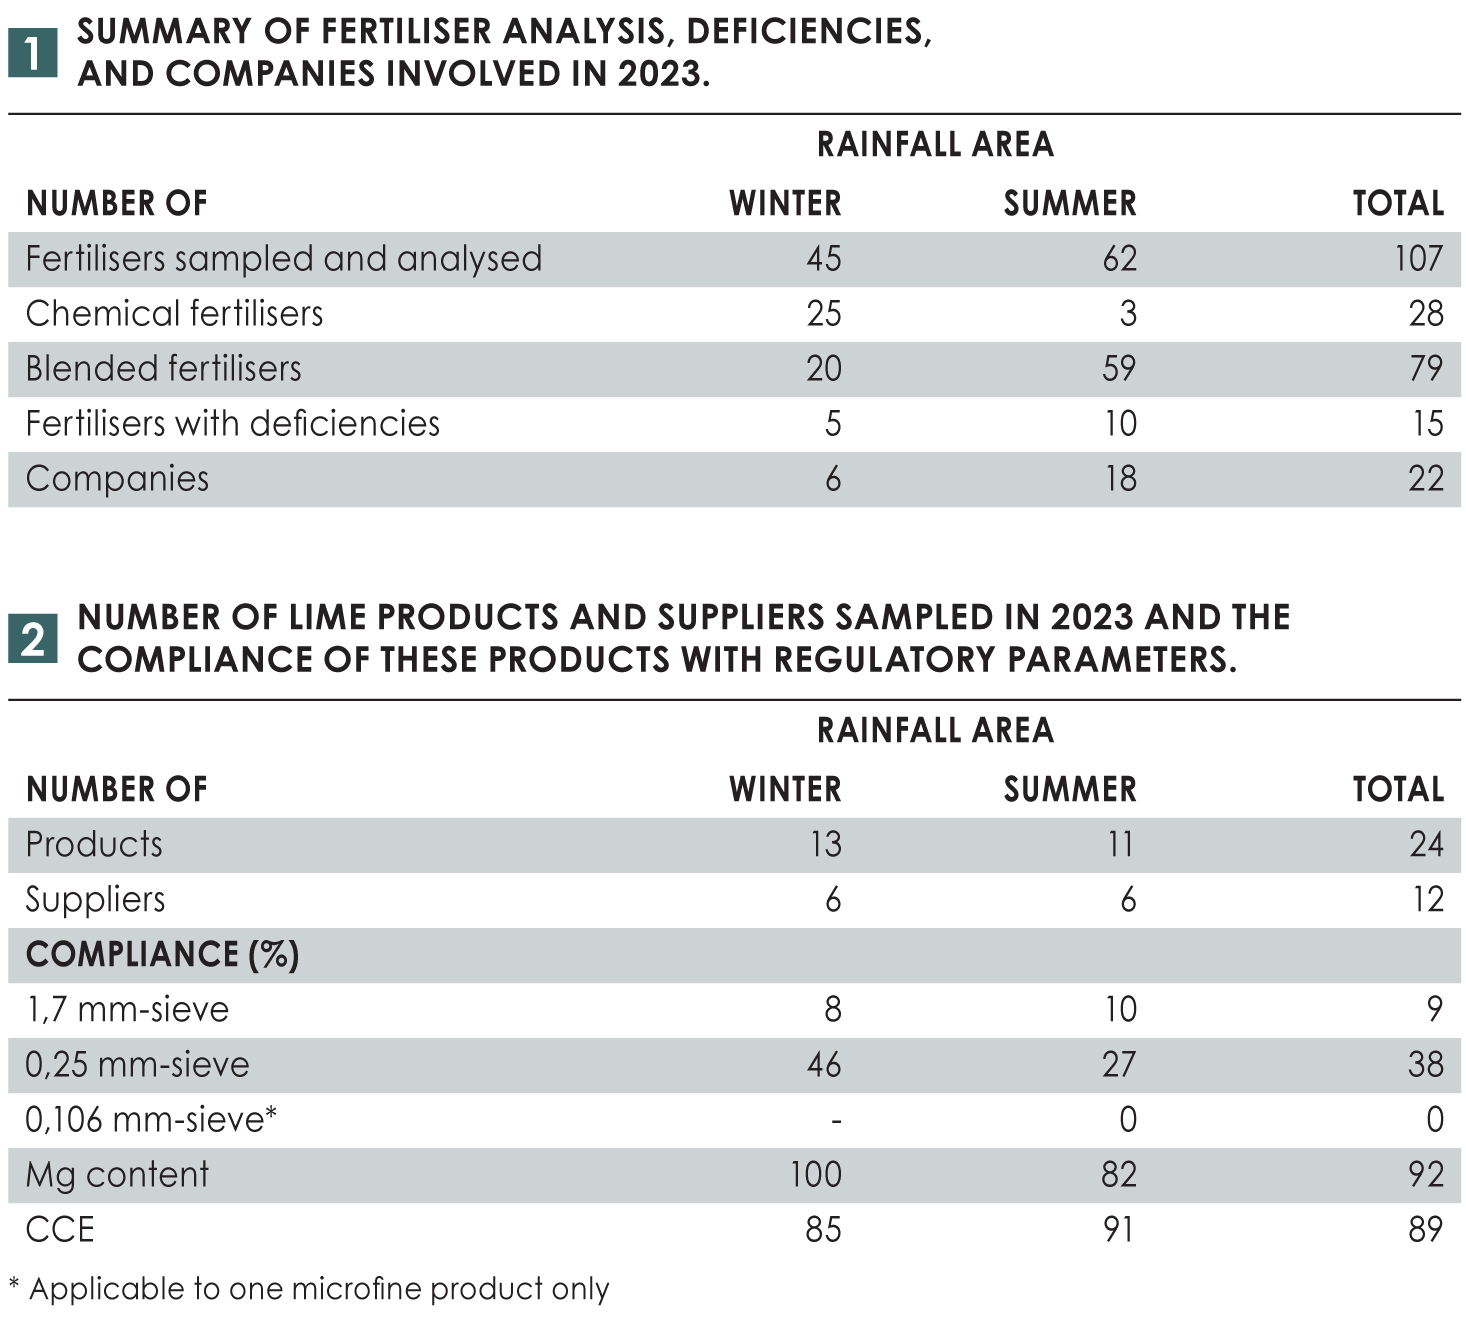
Summary statistics on the number of lime products sampled, analysed and the number of companies involved in 2023 are shown in Table 2. As indicated, 54% of lime samples were taken in the winter rainfall area and 46% in the summer rainfall area. Ten lime products (or 42%) were registered as dolomitic and fourteen (or 58%) as calcitic. One calcitic lime was registered as microfine. The compliance of these lime products with the regulatory parameters are also shown in Table 2.
 Conclusion: lime and gypsum products
The physical quality of most lime products is substandard as only between 8% and 46% of these products were compliant to either of the two sieve requirements. None of these products complied with both fineness requirements simultaneously. The chemical quality of lime products was relatively better with 79% compliance with both the magnesium content and CCE requirements.
The physical and chemical quality of the two gypsum products were satisfactory as it met all requirements.


